


监控手册
1. Nacos 集群监控
Nacos 支持通过暴露metrics数据接入第三方监控系统监控Nacos运行状态,目前支持prometheus、elastic search和influxdb,下面结合prometheus和grafana为例,介绍如何监控Nacos。与elastic search和influxdb结合可自己查找相关资料。
1.1. 开启Nacos集群metrics数据暴露
按照部署文档搭建好Nacos集群后,需要在Nacos集群的每个节点上修改如下参数:
application.properties文件,暴露metrics数据
management.endpoints.web.exposure.include=prometheus重启后,访问{ip}:8848/nacos/actuator/prometheus,即可访问到Nacos集群的metrics数据。
1.2. 搭建prometheus采集Nacos metrics数据
请参考FIRST STEPS WITH PROMETHEUS部署prometheus
其中,需要将prometheus的配置文件prometheus.yml关于采集目标相关的配置,修改为如下内容
metrics_path: '/nacos/actuator/prometheus' static_configs: - targets: ['{nacos.ip1}:8848','{nacos.ip2}:8848','{nacos.ip3}:8848',...]搭建并启动完成prometheus后,即可通过浏览器访问http://{prometheus_ip}:9090/graph可以看到prometheus的采集数据,在搜索栏搜索nacos_monitor可以搜索到Nacos数据说明采集数据成功。
1.3. 搭建grafana图形化展示Nacos metrics数据
参考Install Grafana 部署grafana。
之后在浏览器中访问 http://{grafana_ip}:3000
然后参考Configure Prometheus,将刚才部署的prometheus作为Grafana的数据源。
随后参考Import dashboards导入Nacos grafana监控模版
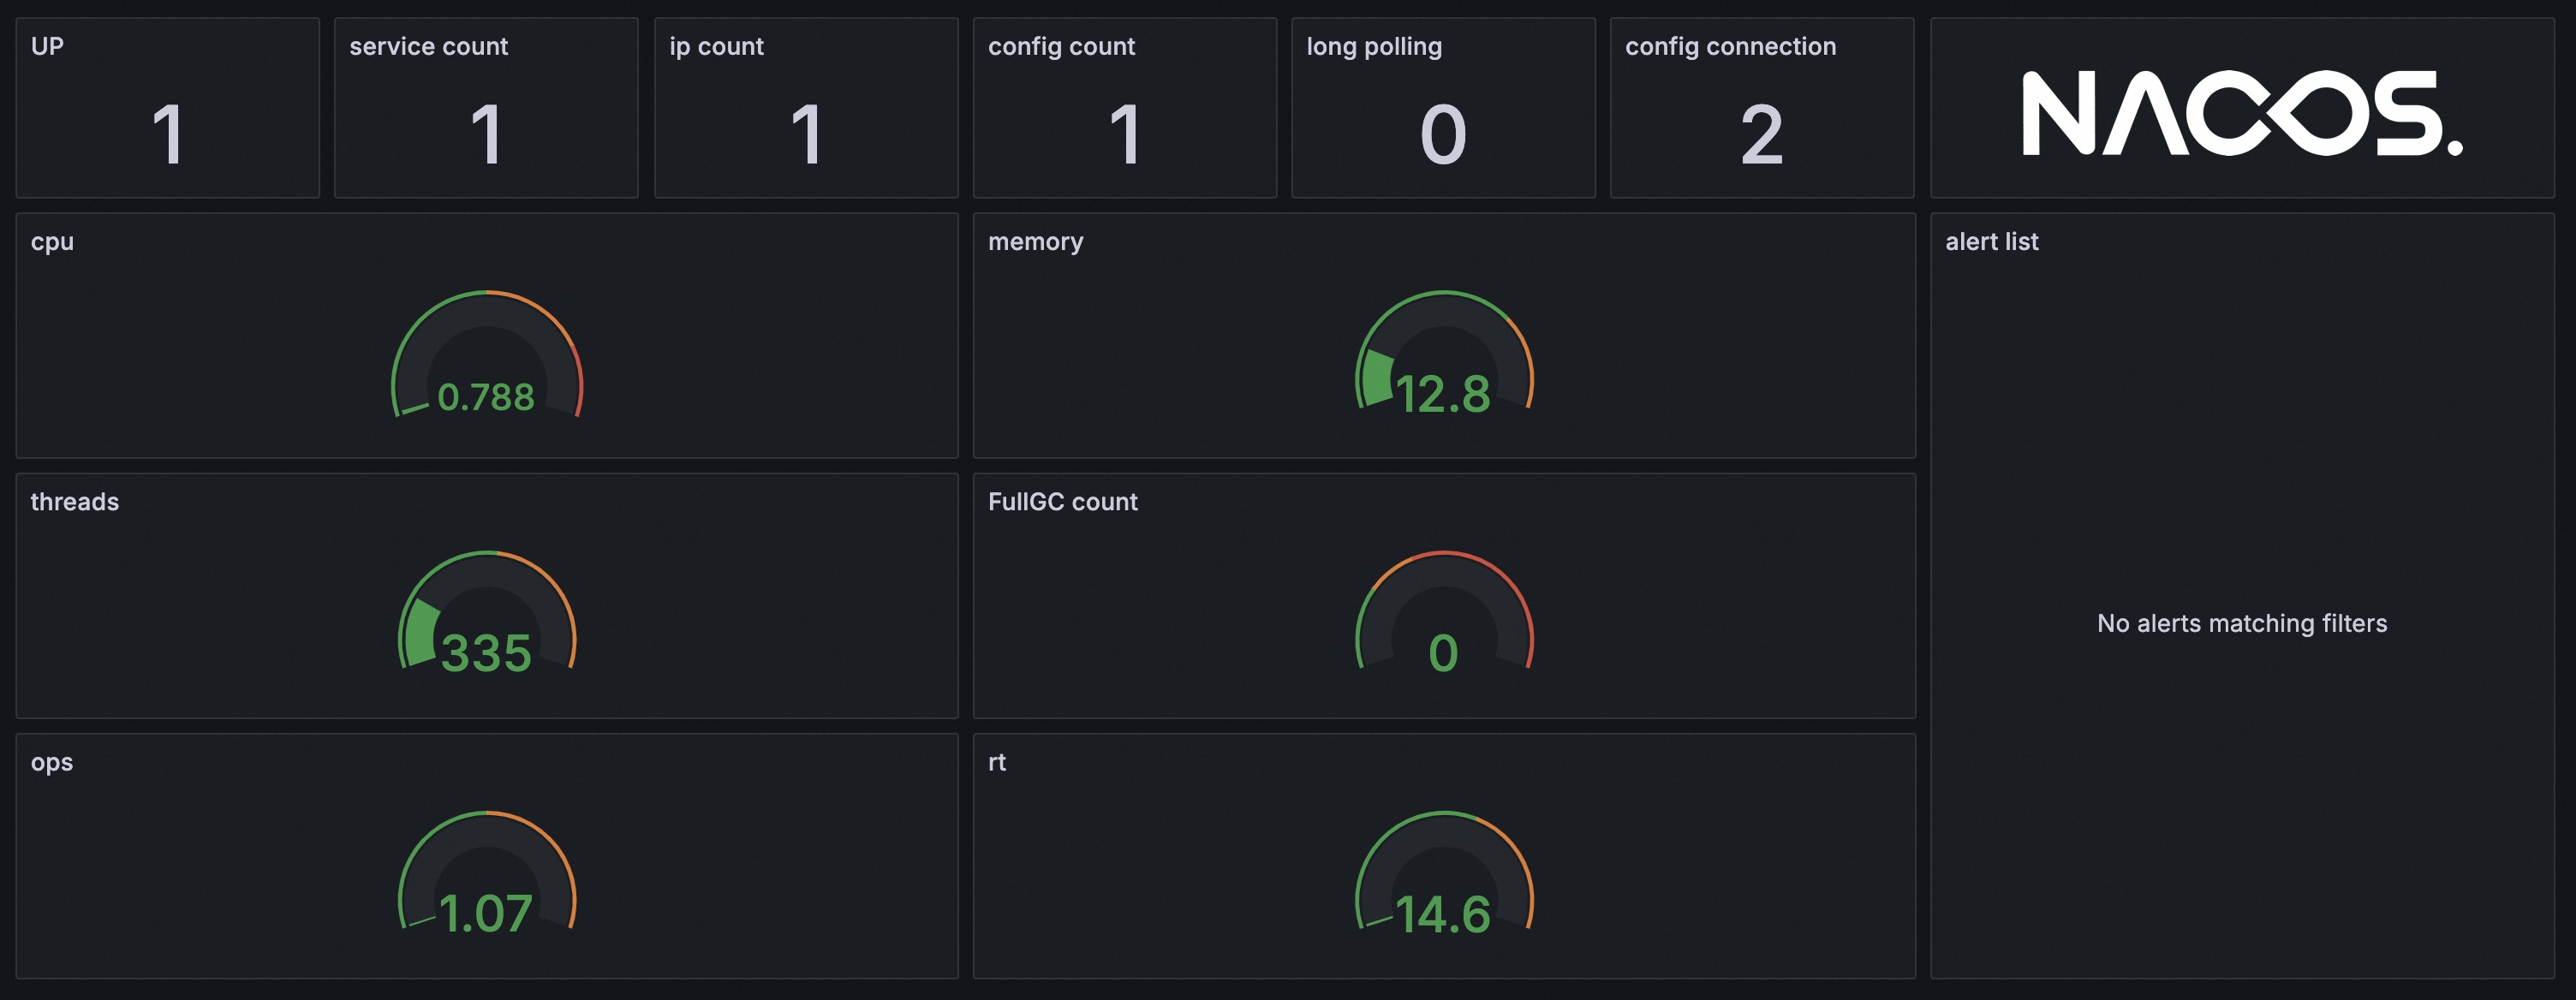
导入后可看见Nacos监控模版,Nacos监控主要分为三个模块:
-
nacos overview: 展示Nacos集群当前的概览信息,如节点个数,服务数,服务提供者数、配置数、连接数,CPU使用率等。
-
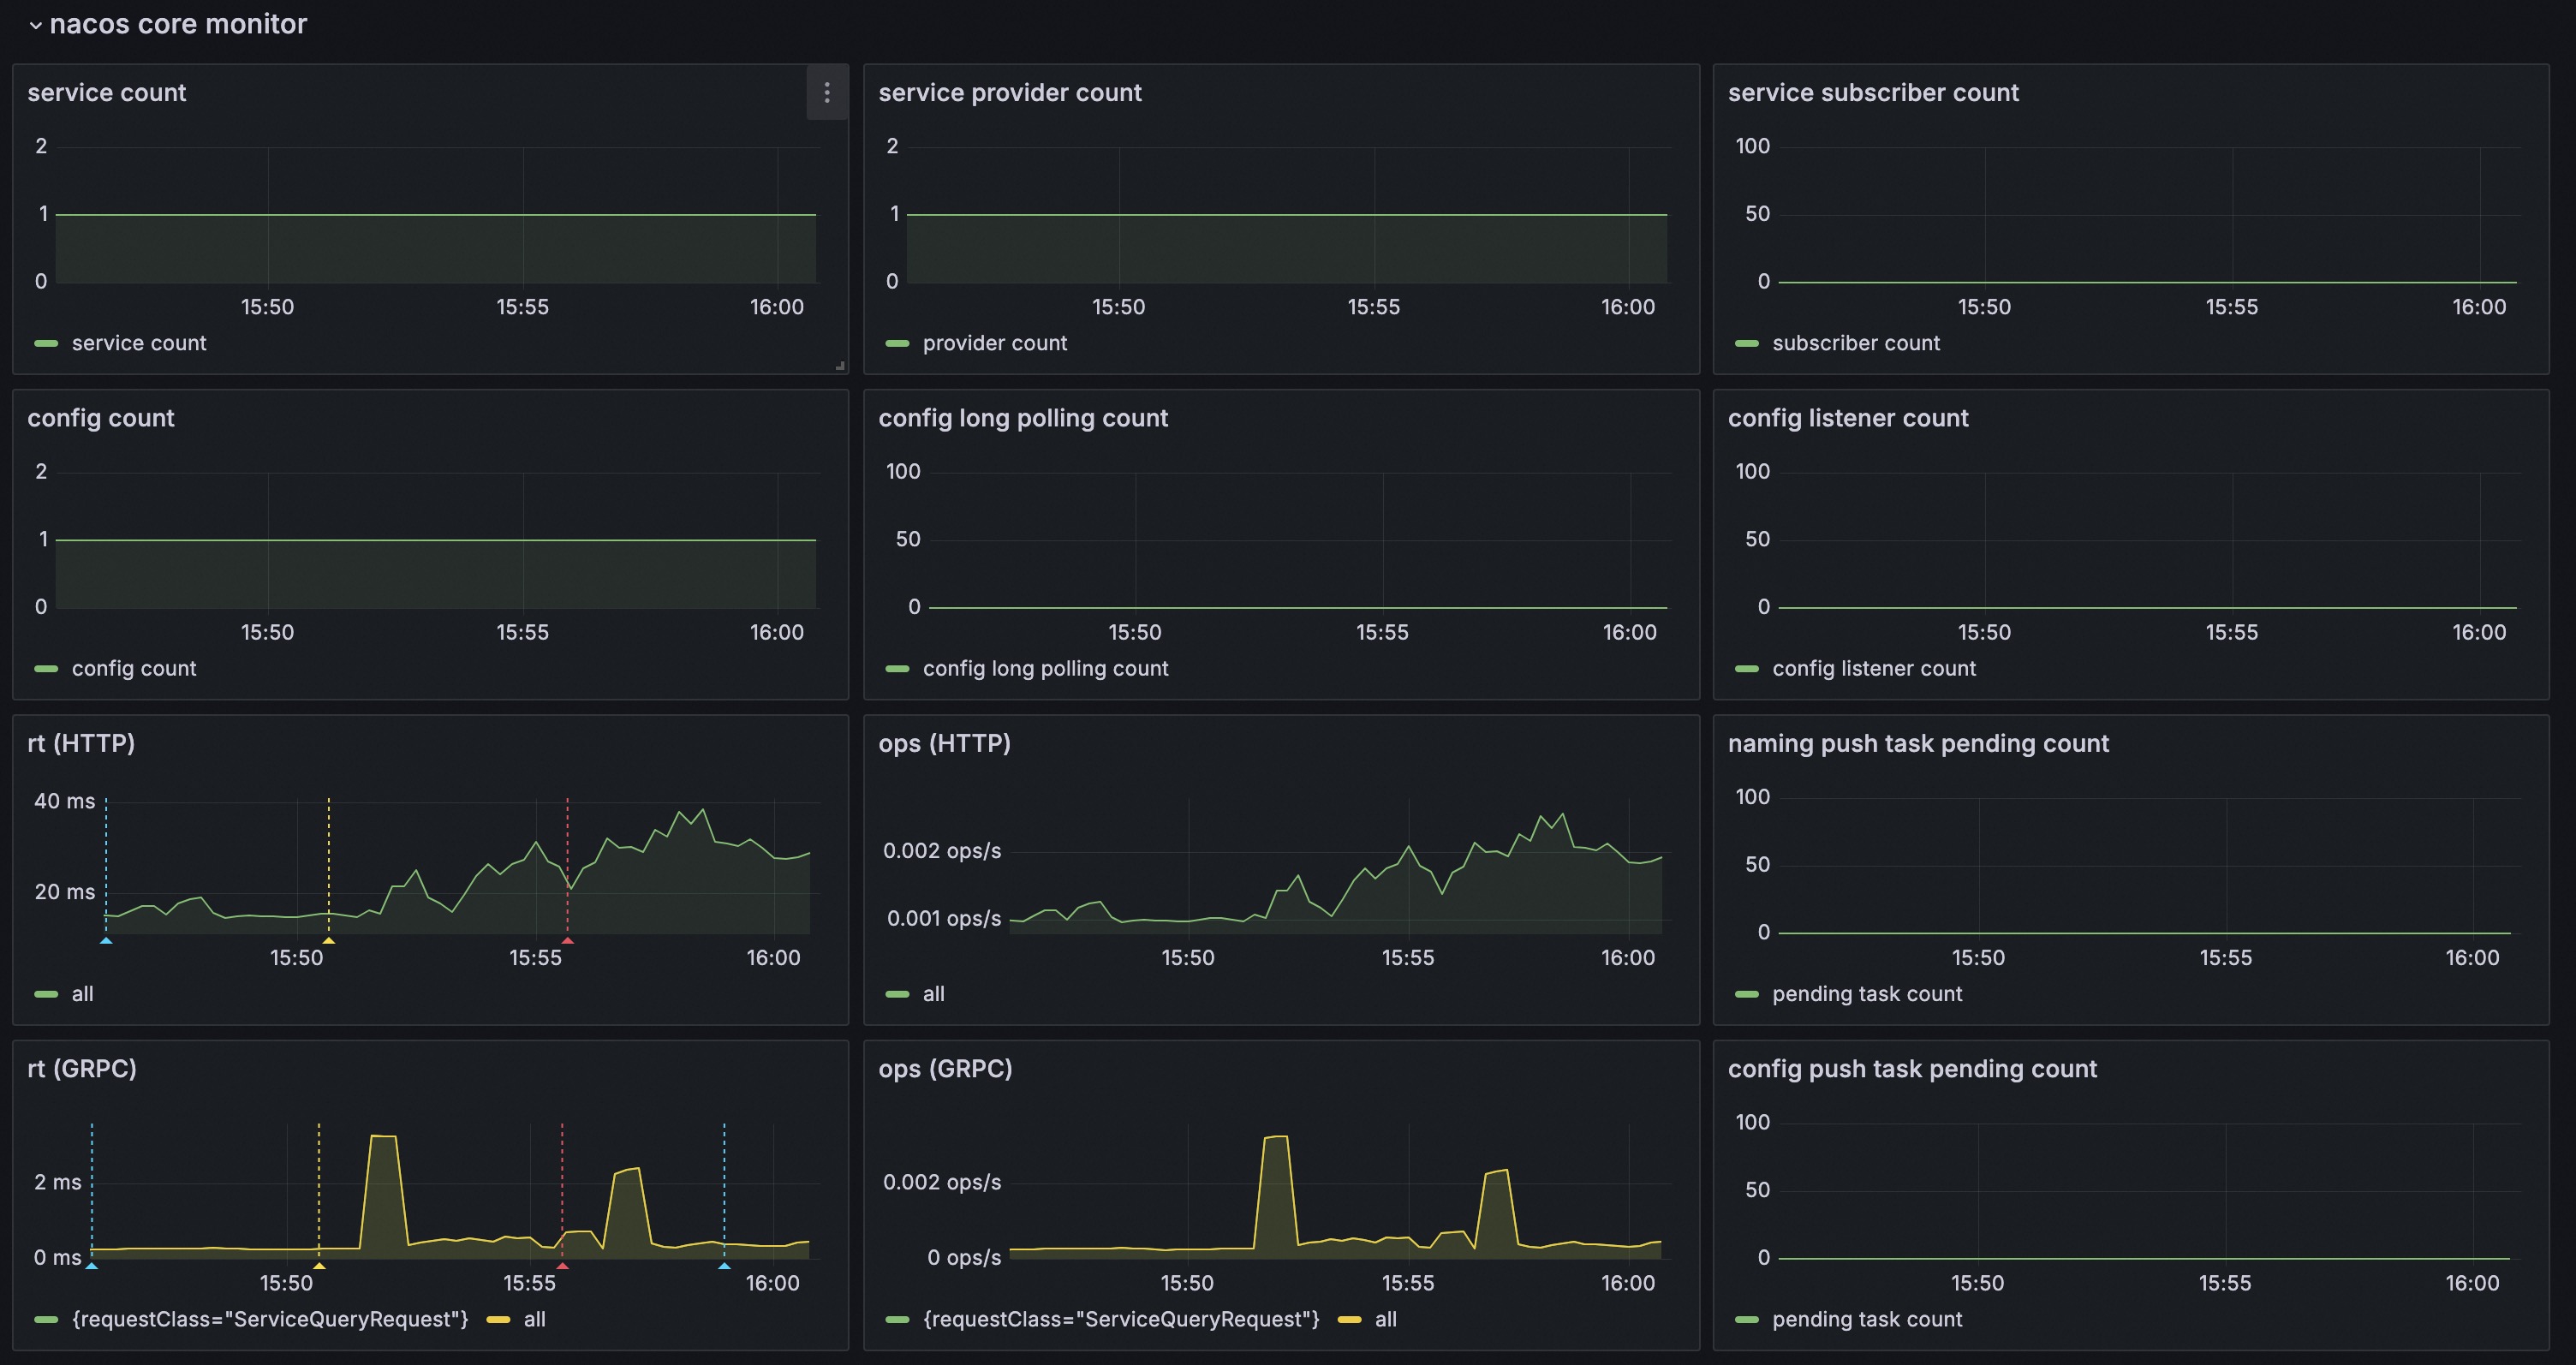
nacos core monitor: 展示Nacos集群核心的监控指标,如服务提供者数,配置数,ops,rt等,并能够查看一定时间内的变化趋势。
-
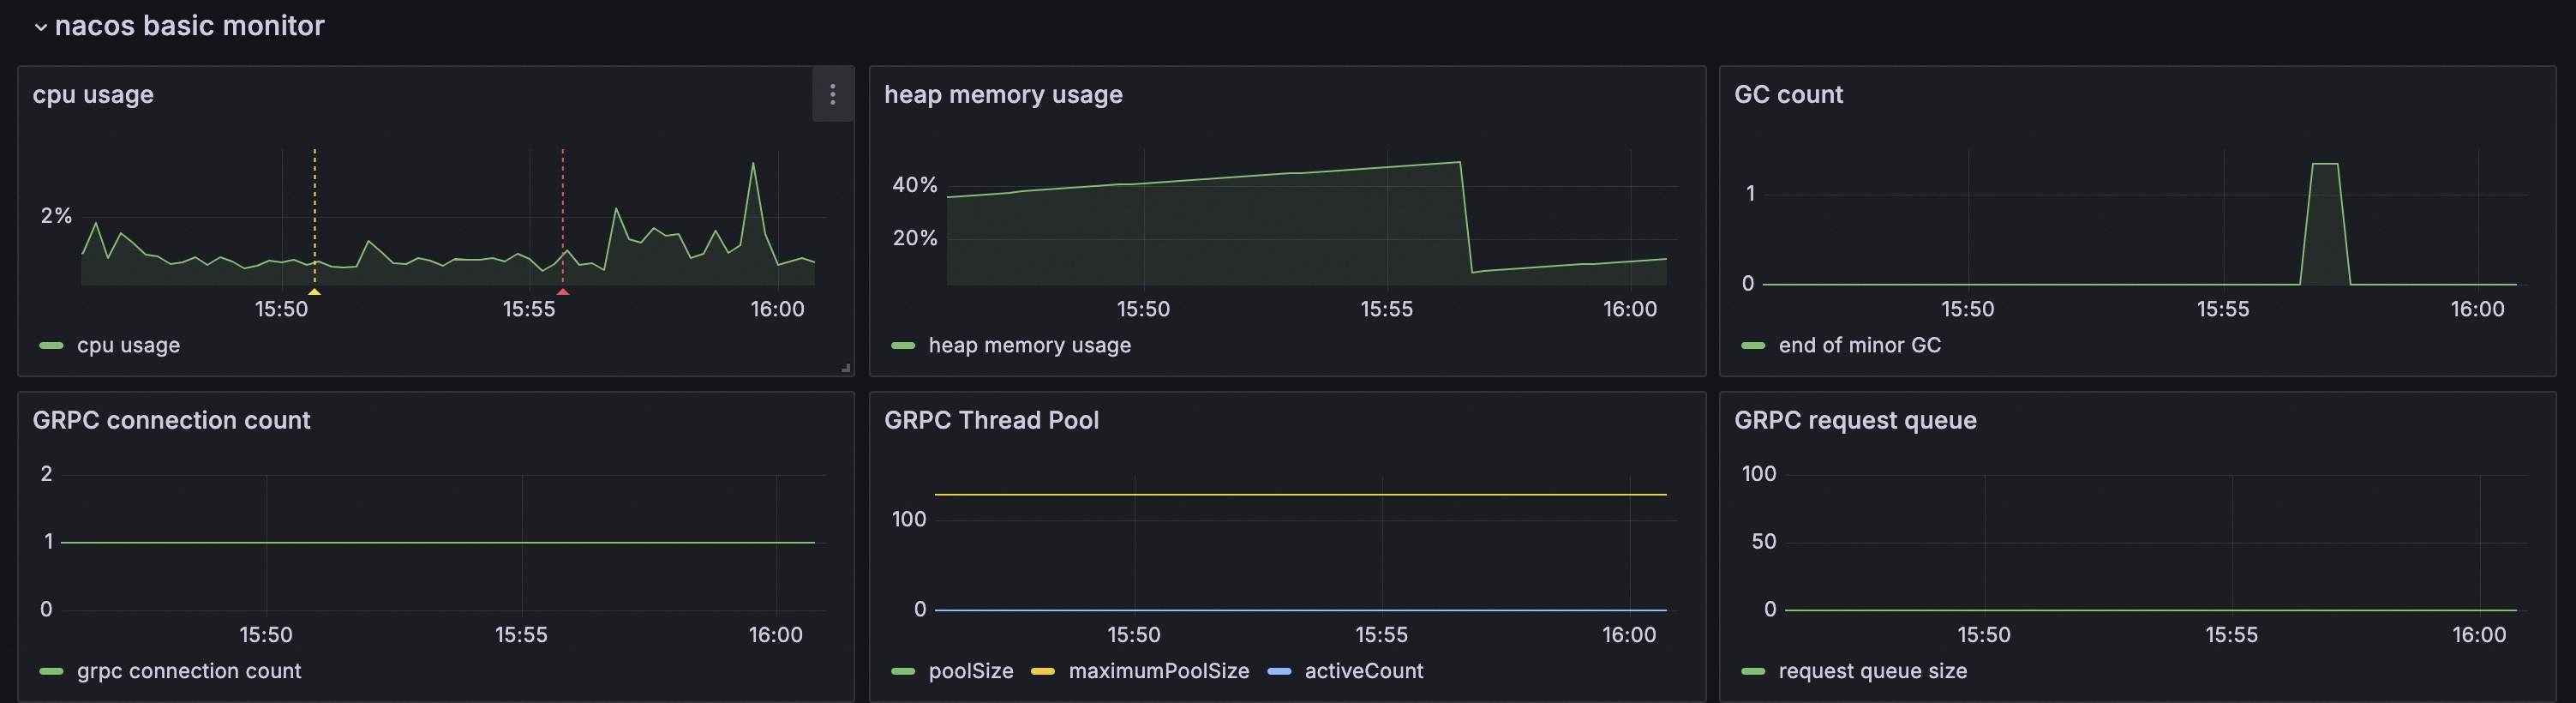
nacos basic monitor: 展示Nacos集群基础的监控指标,如CPU使用率,内存使用率,线程池使用情况等,并能够查看一定时间内的变化趋势。
1.4. 配置Nacos集群告警
1.4.1. 配置Grafana告警
可以参考Configure Grafana-managed alert rules,配置自定义的Nacos相关告警。
也可以通过大盘中的对应指标内容,快速配置告警:
- 选择需要配置告警的指标,例如
cpu usage; - 在指标的右上角,点击
Menu(展示为竖直的3个.),选择编辑(Edit);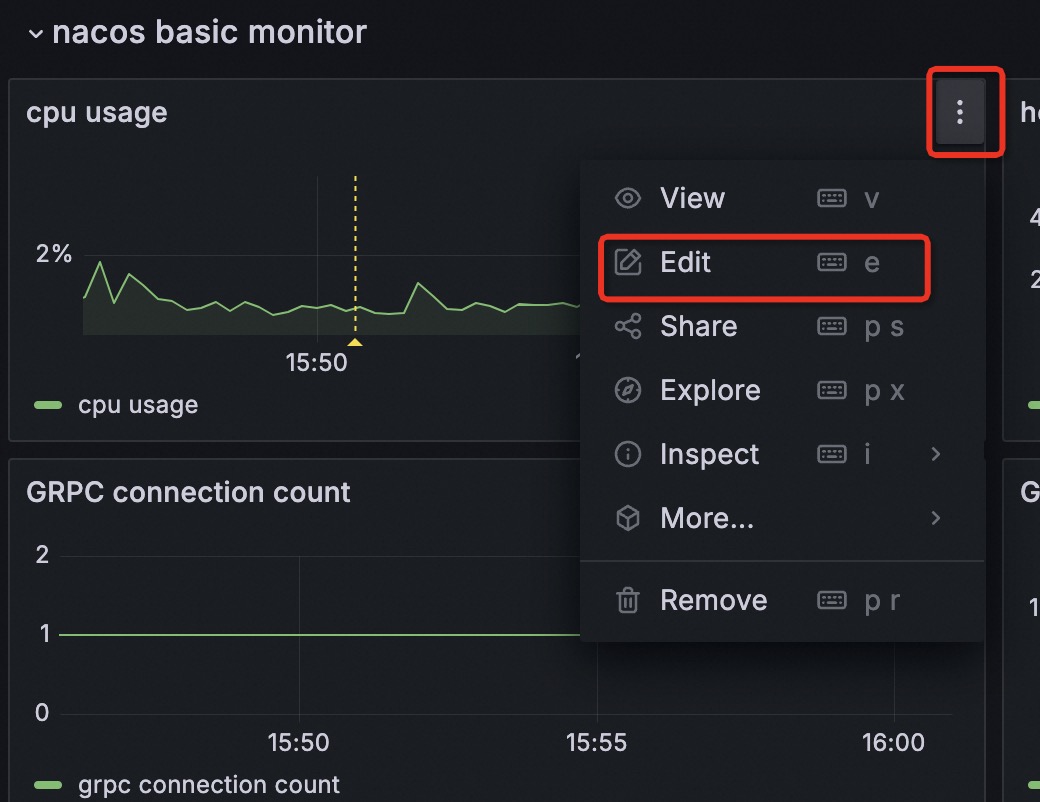
- 在Panel页面中,选择
Alert,点击New alert rule,配置告警规则。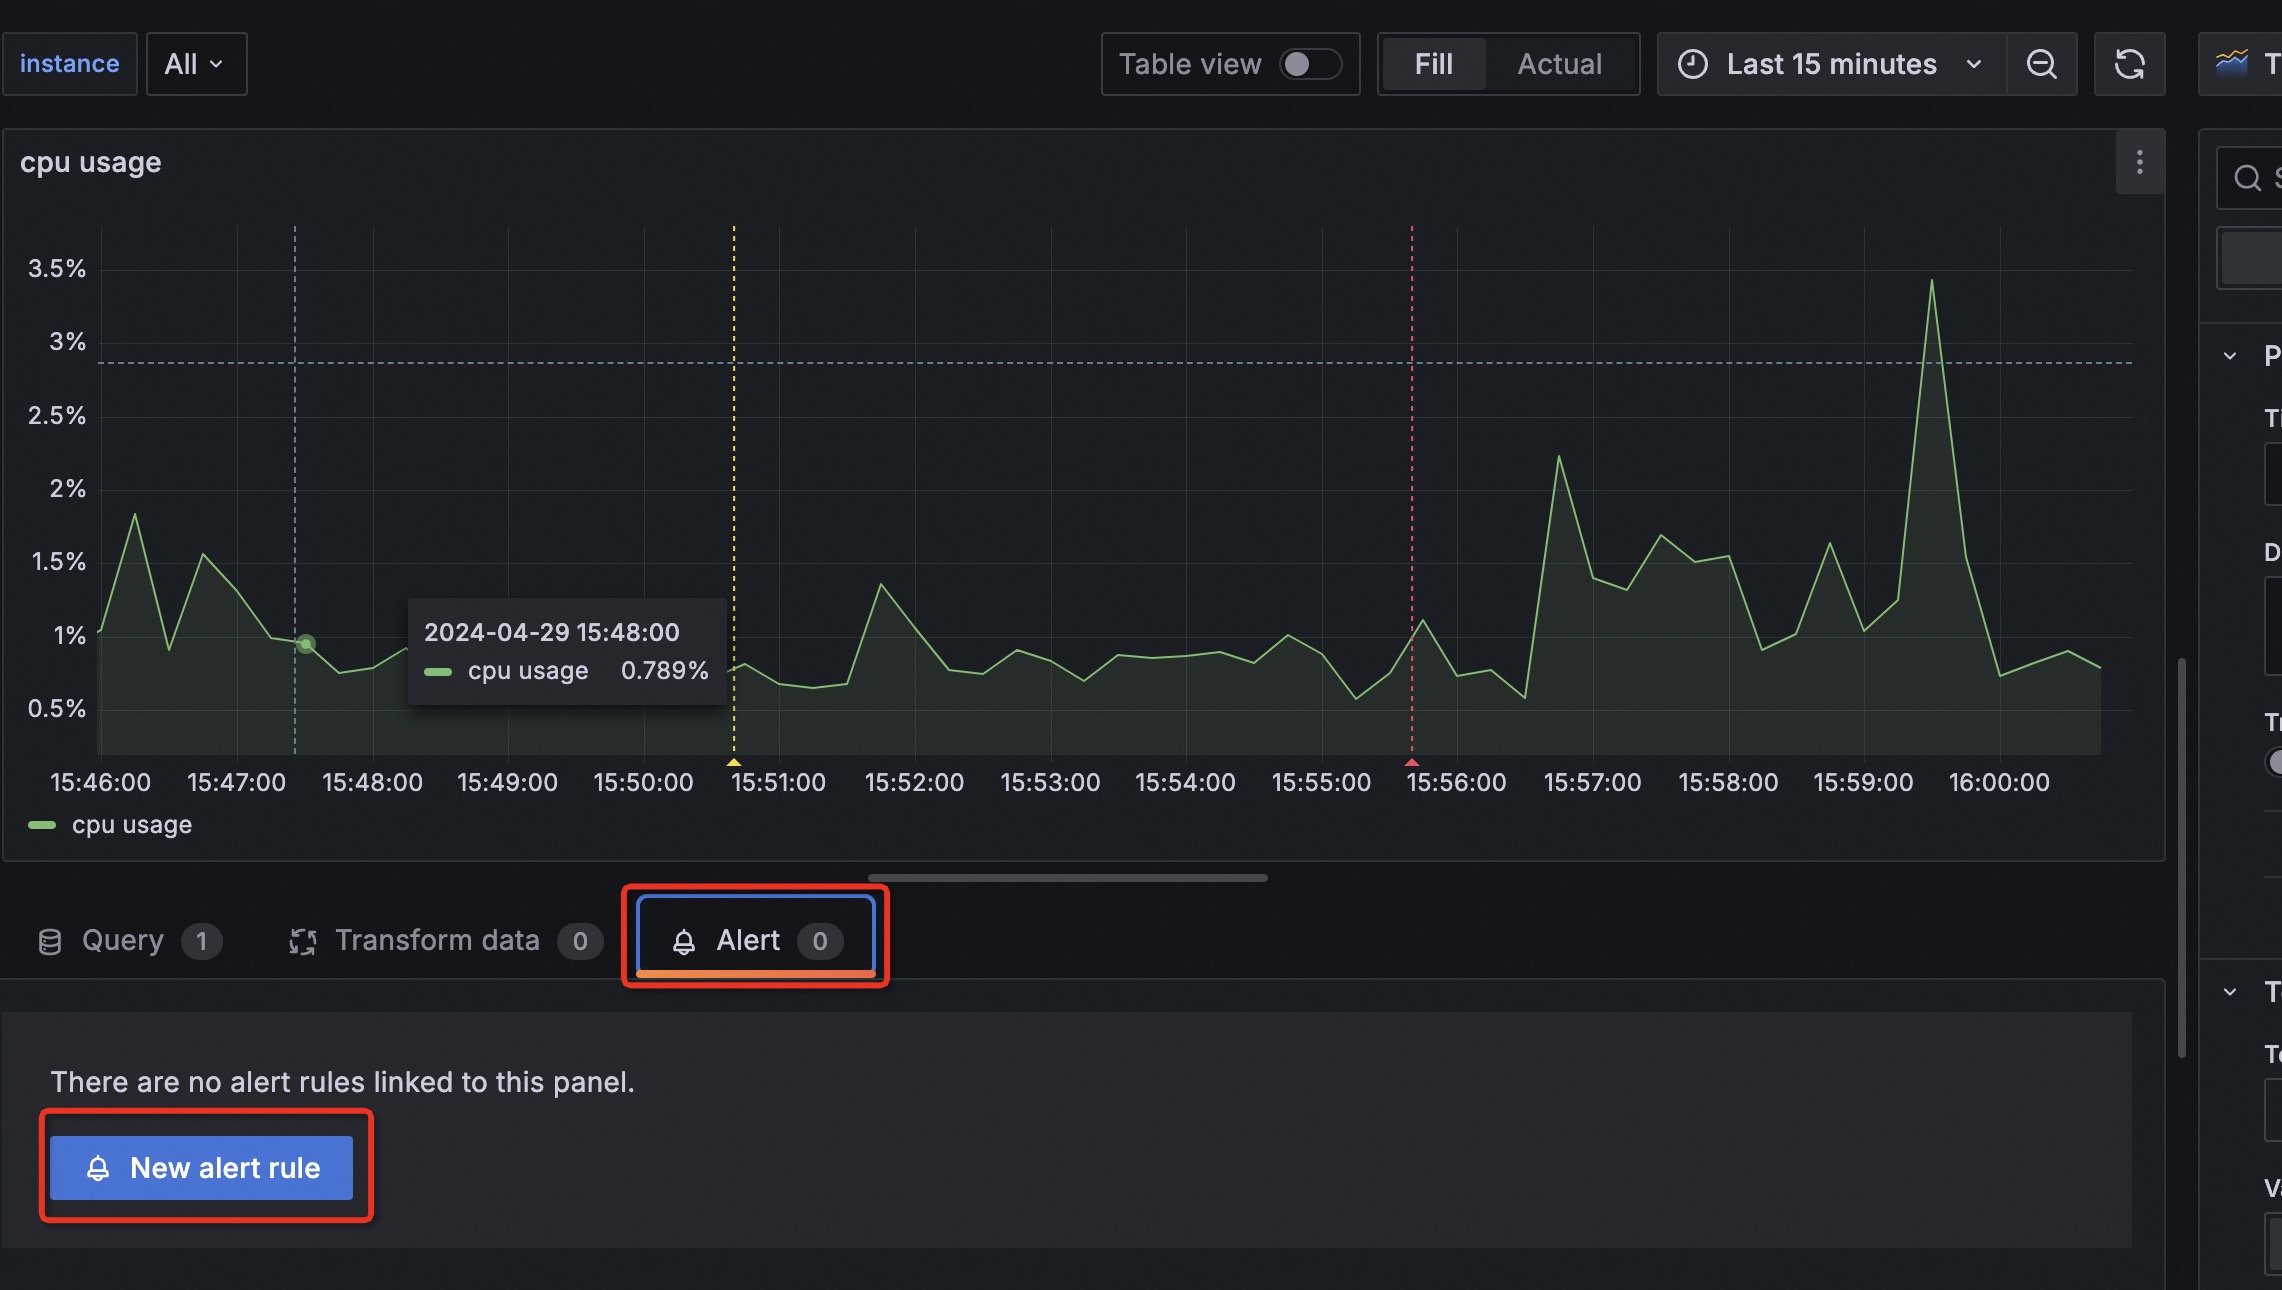
- 之后同样参考Configure Grafana-managed alert rules,配置自定义的Nacos相关告警。
1.4.2. 配置Grafana告警通知
参考Configure contact points 来配置Grafana告警时的通知方式。例如配置邮件通知、钉钉WebHook通知等。
1.5. Nacos 指标含义
1.5.1. Nacos 系统基础资源指标
| 指标 | 含义 |
|---|---|
| system_cpu_usage | CPU使用率 |
| system_load_average_1m | load |
| jvm_memory_used_bytes | JVM内存使用字节,包含各种内存区 |
| jvm_memory_max_bytes | JVM内存最大字节,包含各种内存区 |
| jvm_gc_pause_seconds_count | gc次数,包含各种gc |
| jvm_gc_pause_seconds_sum | gc耗时,包含各种gc |
| jvm_threads_daemon | 线程数 |
1.5.2. Nacos 集群应用指标
| 指标 | 含义 |
|---|---|
| http_server_requests_seconds_count | http请求次数,包括多种(url,方法,code) |
| http_server_requests_seconds_sum | http请求总耗时,包括多种(url,方法,code) |
| grpc_server_requests_seconds_count | Nacos grpc请求次数,包括多种(requestClass,code) |
| grpc_server_requests_seconds_sum | Nacos grpc请求总耗时,包括多种(requestClass,code) |
| nacos_timer_seconds_sum | Nacos config水平通知耗时 |
| nacos_timer_seconds_count | Nacos config水平通知次数 |
| grpc_server_executor{name=‘maximumPoolSize’} | Nacos grpc服务器线程池的最大线程数 |
| grpc_server_executor{name=‘corePoolSize’} | Nacos grpc服务器线程池的核心线程数 |
| grpc_server_executor{name=‘taskCount’} | Nacos grpc服务器线程池的任务数量 |
| grpc_server_executor{name=‘poolSize’} | Nacos grpc服务器线程池当前线程数量 |
| grpc_server_executor{name=‘activeCount’} | Nacos grpc服务器线程池当前活跃的线程数量 |
| grpc_server_executor{name=‘completedTaskCount’} | Nacos grpc服务器线程池完成的任务数量 |
| grpc_server_executor{name=‘inQueueTaskCount’} | Nacos grpc服务器线程池在任务队列中的任务数量 |
| nacos_monitor{name=‘longPolling’} | Nacos config长连接数 |
| nacos_monitor{name=‘configCount’} | Nacos config配置个数 |
| nacos_monitor{name=‘dumpTask’} | Nacos config配置落盘任务堆积数 |
| nacos_monitor{name=‘notifyTask’} | Nacos config配置水平通知任务堆积数 |
| nacos_monitor{name=‘getConfig’} | Nacos config读配置统计数 |
| nacos_monitor{name=‘publish’} | Nacos config写配置统计数 |
| nacos_monitor{name=‘ipCount’} | Nacos naming ip个数 |
| nacos_monitor{name=‘serviceCount’} | Nacos naming域名个数 |
| nacos_monitor{name=‘failedPush’} | Nacos naming推送失败数 |
| nacos_monitor{name=‘avgPushCost’} | Nacos naming平均推送耗时(ms) |
| nacos_monitor{name=‘leaderStatus’} | Nacos naming角色状态 |
| nacos_monitor{name=‘maxPushCost’} | Nacos naming最大推送耗时(ms) |
| nacos_monitor{name=‘mysqlhealthCheck’} | Nacos naming mysql健康检查次数 |
| nacos_monitor{name=‘httpHealthCheck’} | Nacos naming http健康检查次数 |
| nacos_monitor{name=‘tcpHealthCheck’} | Nacos naming tcp健康检查次数 |
| nacos_monitor{name=‘longConnection’} | Nacos基于模块划分的连接数量 |
| nacos_naming_subscriber{version=‘v1/v2’} | Nacos naming服务订阅者数量,v1/v2表示订阅者的客户端版本 |
| nacos_config_subscriber{version=‘v1/v2’} | Nacos config配置监听者数量,v1/v2表示订阅者的客户端版本 |
| nacos_naming_publisher{version=‘v1/v2’} | Nacos naming服务提供者数量,v1/v2表示订阅者的客户端版本 |
2. Nacos-Sync监控
Nacos-Sync 同样支持了第三方监控系统,能通过metrics数据观察Nacos-Sync服务的运行状态,提升了Nacos-Sync的在生产环境的监控能力。 整体的监控体系的搭建参考上文的Nacos 集群监控,进行prometheus和grafana的部署即可。
2.1. grafana监控Nacos-Sync
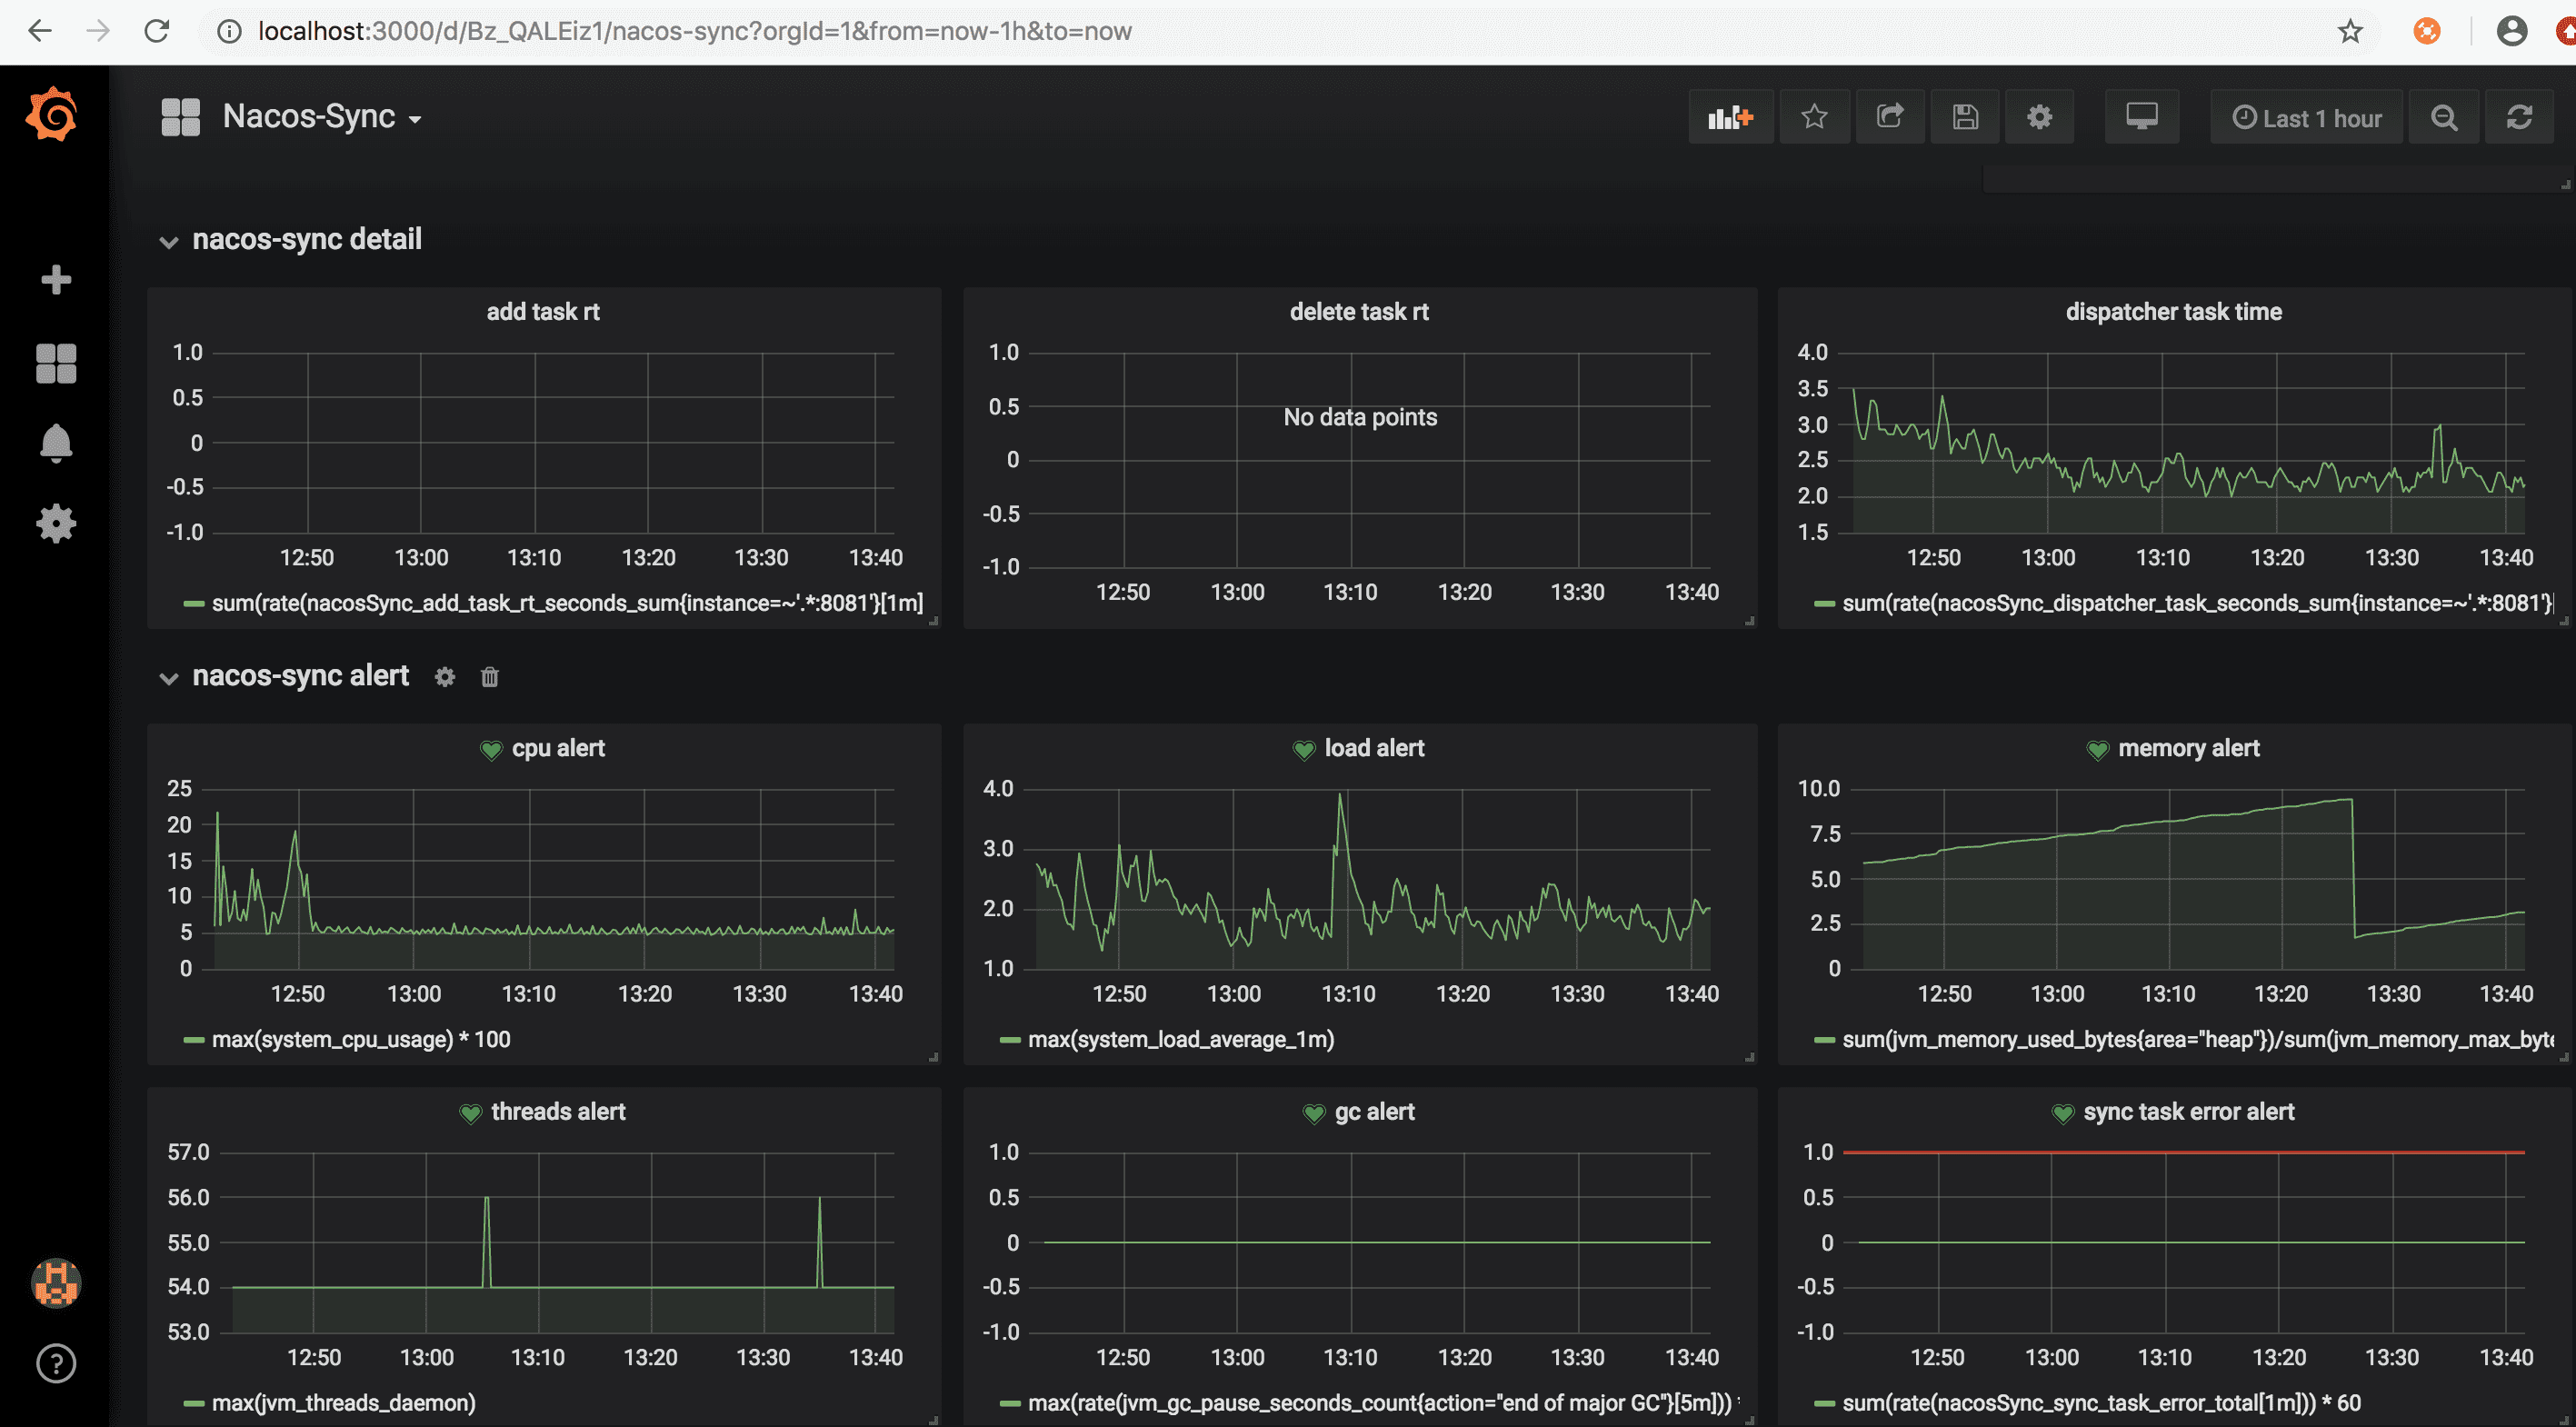
和Nacos监控一样,Nacos-Sync也提供了监控模版,导入监控模版
Nacos-Sync监控同样也分为三个模块:
- nacos-sync monitor展示核心监控项

- nacos-sync detail和alert展示监控曲线和告警
2.2. Nacos-Sync 指标含义
Nacos-Sync的metrics分为jvm层和应用层
2.2.1. jvm 指标
| 指标 | 含义 |
|---|---|
| system_cpu_usage | CPU使用率 |
| system_load_average_1m | load |
| jvm_memory_used_bytes | 内存使用字节,包含各种内存区 |
| jvm_memory_max_bytes | 内存最大字节,包含各种内存区 |
| jvm_gc_pause_seconds_count | gc次数,包含各种gc |
| jvm_gc_pause_seconds_sum | gc耗时,包含各种gc |
| jvm_threads_daemon | 线程数 |
2.2.2. 应用层 指标
| 指标 | 含义 |
|---|---|
| nacosSync_task_size | 同步任务数 |
| nacosSync_cluster_size | 集群数 |
| nacosSync_add_task_rt | 同步任务执行耗时 |
| nacosSync_delete_task_rt | 删除任务耗时 |
| nacosSync_dispatcher_task | 从数据库中分发任务 |
| nacosSync_sync_task_error | 所有同步执行时的异常 |