


- Nacos
Nacos monitor guide
Nacos 0.8.0 improves the monitoring system, supporting Nacos operation status monitoring through exposing metrics data access to third-party monitoring system. Currently, prometheus, elastic search and influxdb are supported. The docs introduce how prometheus and grafana monitor Nacos. Here is Nacos grafana monitoring page. You can find out for yourself how to use elastic search and influxdb.
Deploy Nacos cluster to expose metrics data
Deploy the Nacos cluster according to the deploy document
Configure the application. properties file to expose metrics data
management.endpoints.web.exposure.include=*
Access {ip}:8848/nacos/actuator/prometheus to see if metrics data can be accessed
Deploy prometheus to collect Nacos metrics data
Download the Prometheus version you want to install at the address of download prometheus
linux & mac
Decompress prometheus compression package
tar xvfz prometheus-*.tar.gz
cd prometheus-*
Modify configuration file prometheus.yml to collect Nacos metrics data
    metrics_path: '/nacos/actuator/prometheus'
    static_configs:
      - targets: ['{ip1}:8848','{ip2}:8848','{ip3}:8848']
Start prometheus service
./prometheus --config.file="prometheus.yml"
windows
Download the corresponding version of Windows and decompress it
Modify configuration file prometheus.yml to collect Nacos metrics data
    metrics_path: '/nacos/actuator/prometheus'
    static_configs:
      - targets:['{ip1}:8848','{ip2}:8848','{ip3}:8848']
Start prometheus service
prometheus.exe --config.file=prometheus.yml
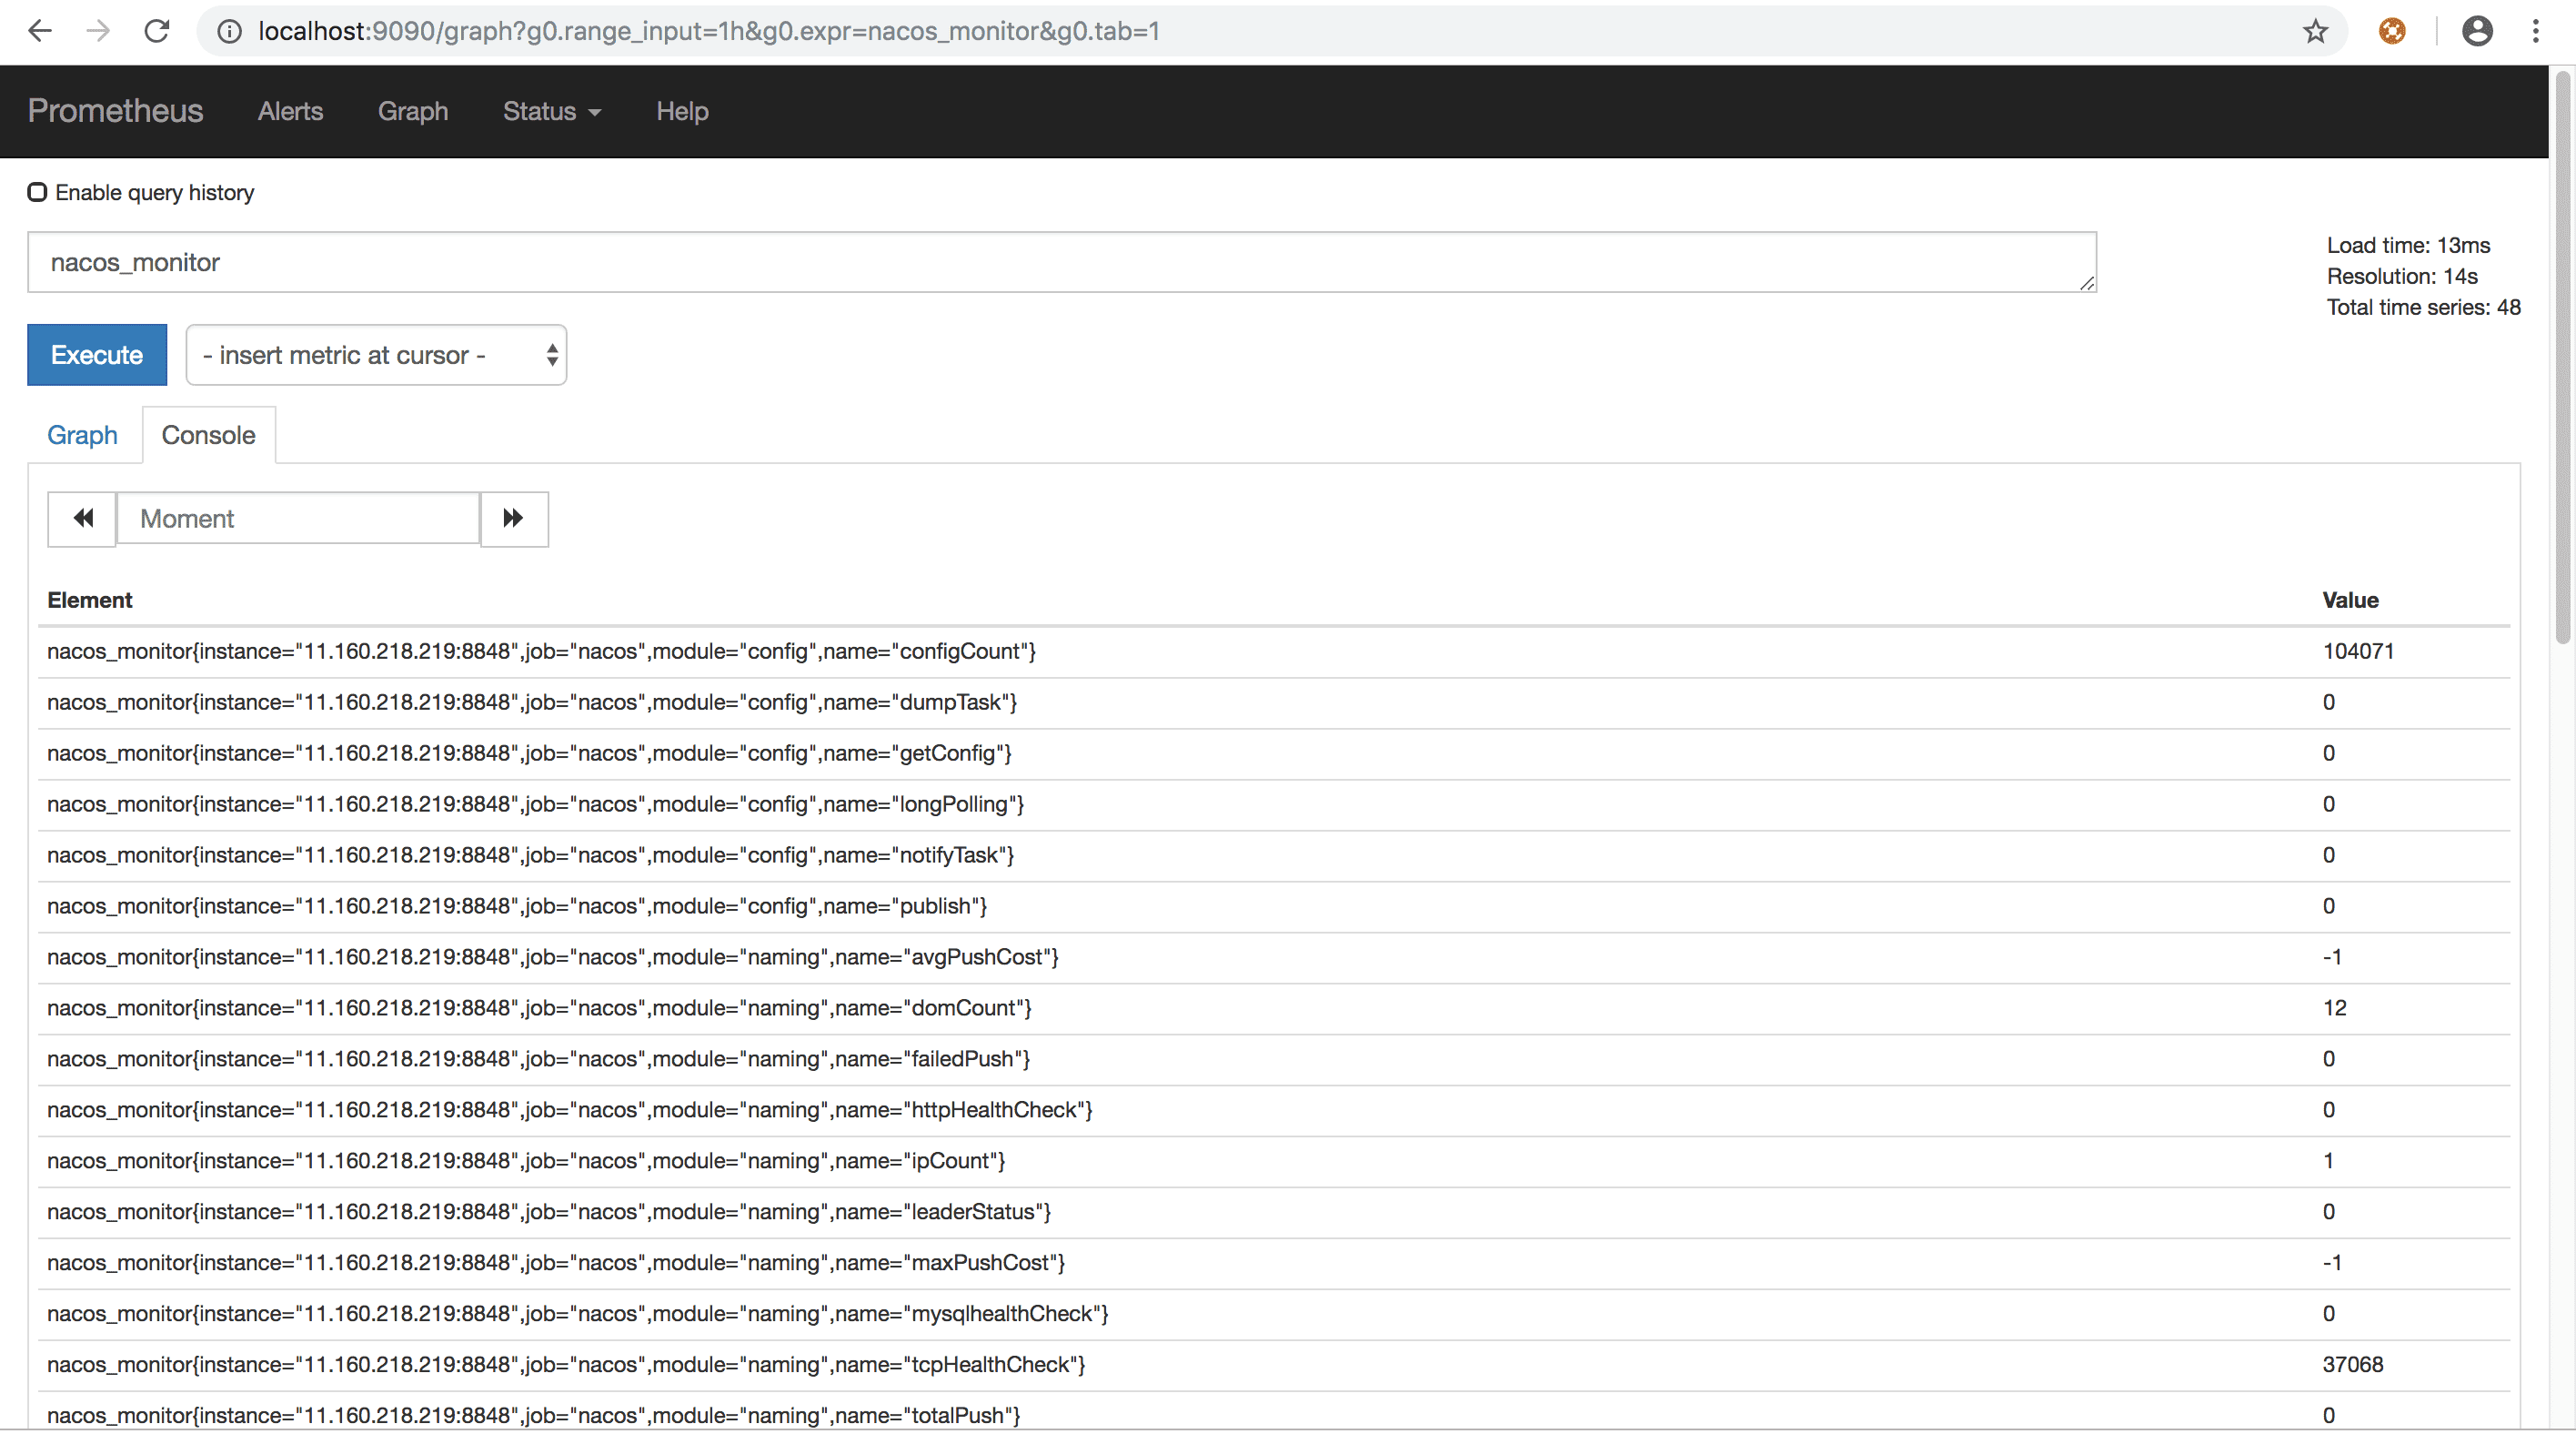
By accessing http://{ip}:9090/graph, we can see the data collected by prometheus. By searching nacos_monitor in the search bar, we can find Nacos data to show the success of the data collection.
Deploy grafana to graphically display metrics data
Install grafana on the same machine as prometheus, and use yum to install grafana
mac
brew install grafana
brew services start grafana
linux
sudo yum install https://s3-us-west-2.amazonaws.com/grafana-releases/release/grafana-5.2.4-1.x86_64.rpm
sudo service grafana-server start
windows
Reference document:http://docs.grafana.org/installation/windows/
Access grafana: http://{ip}:3000
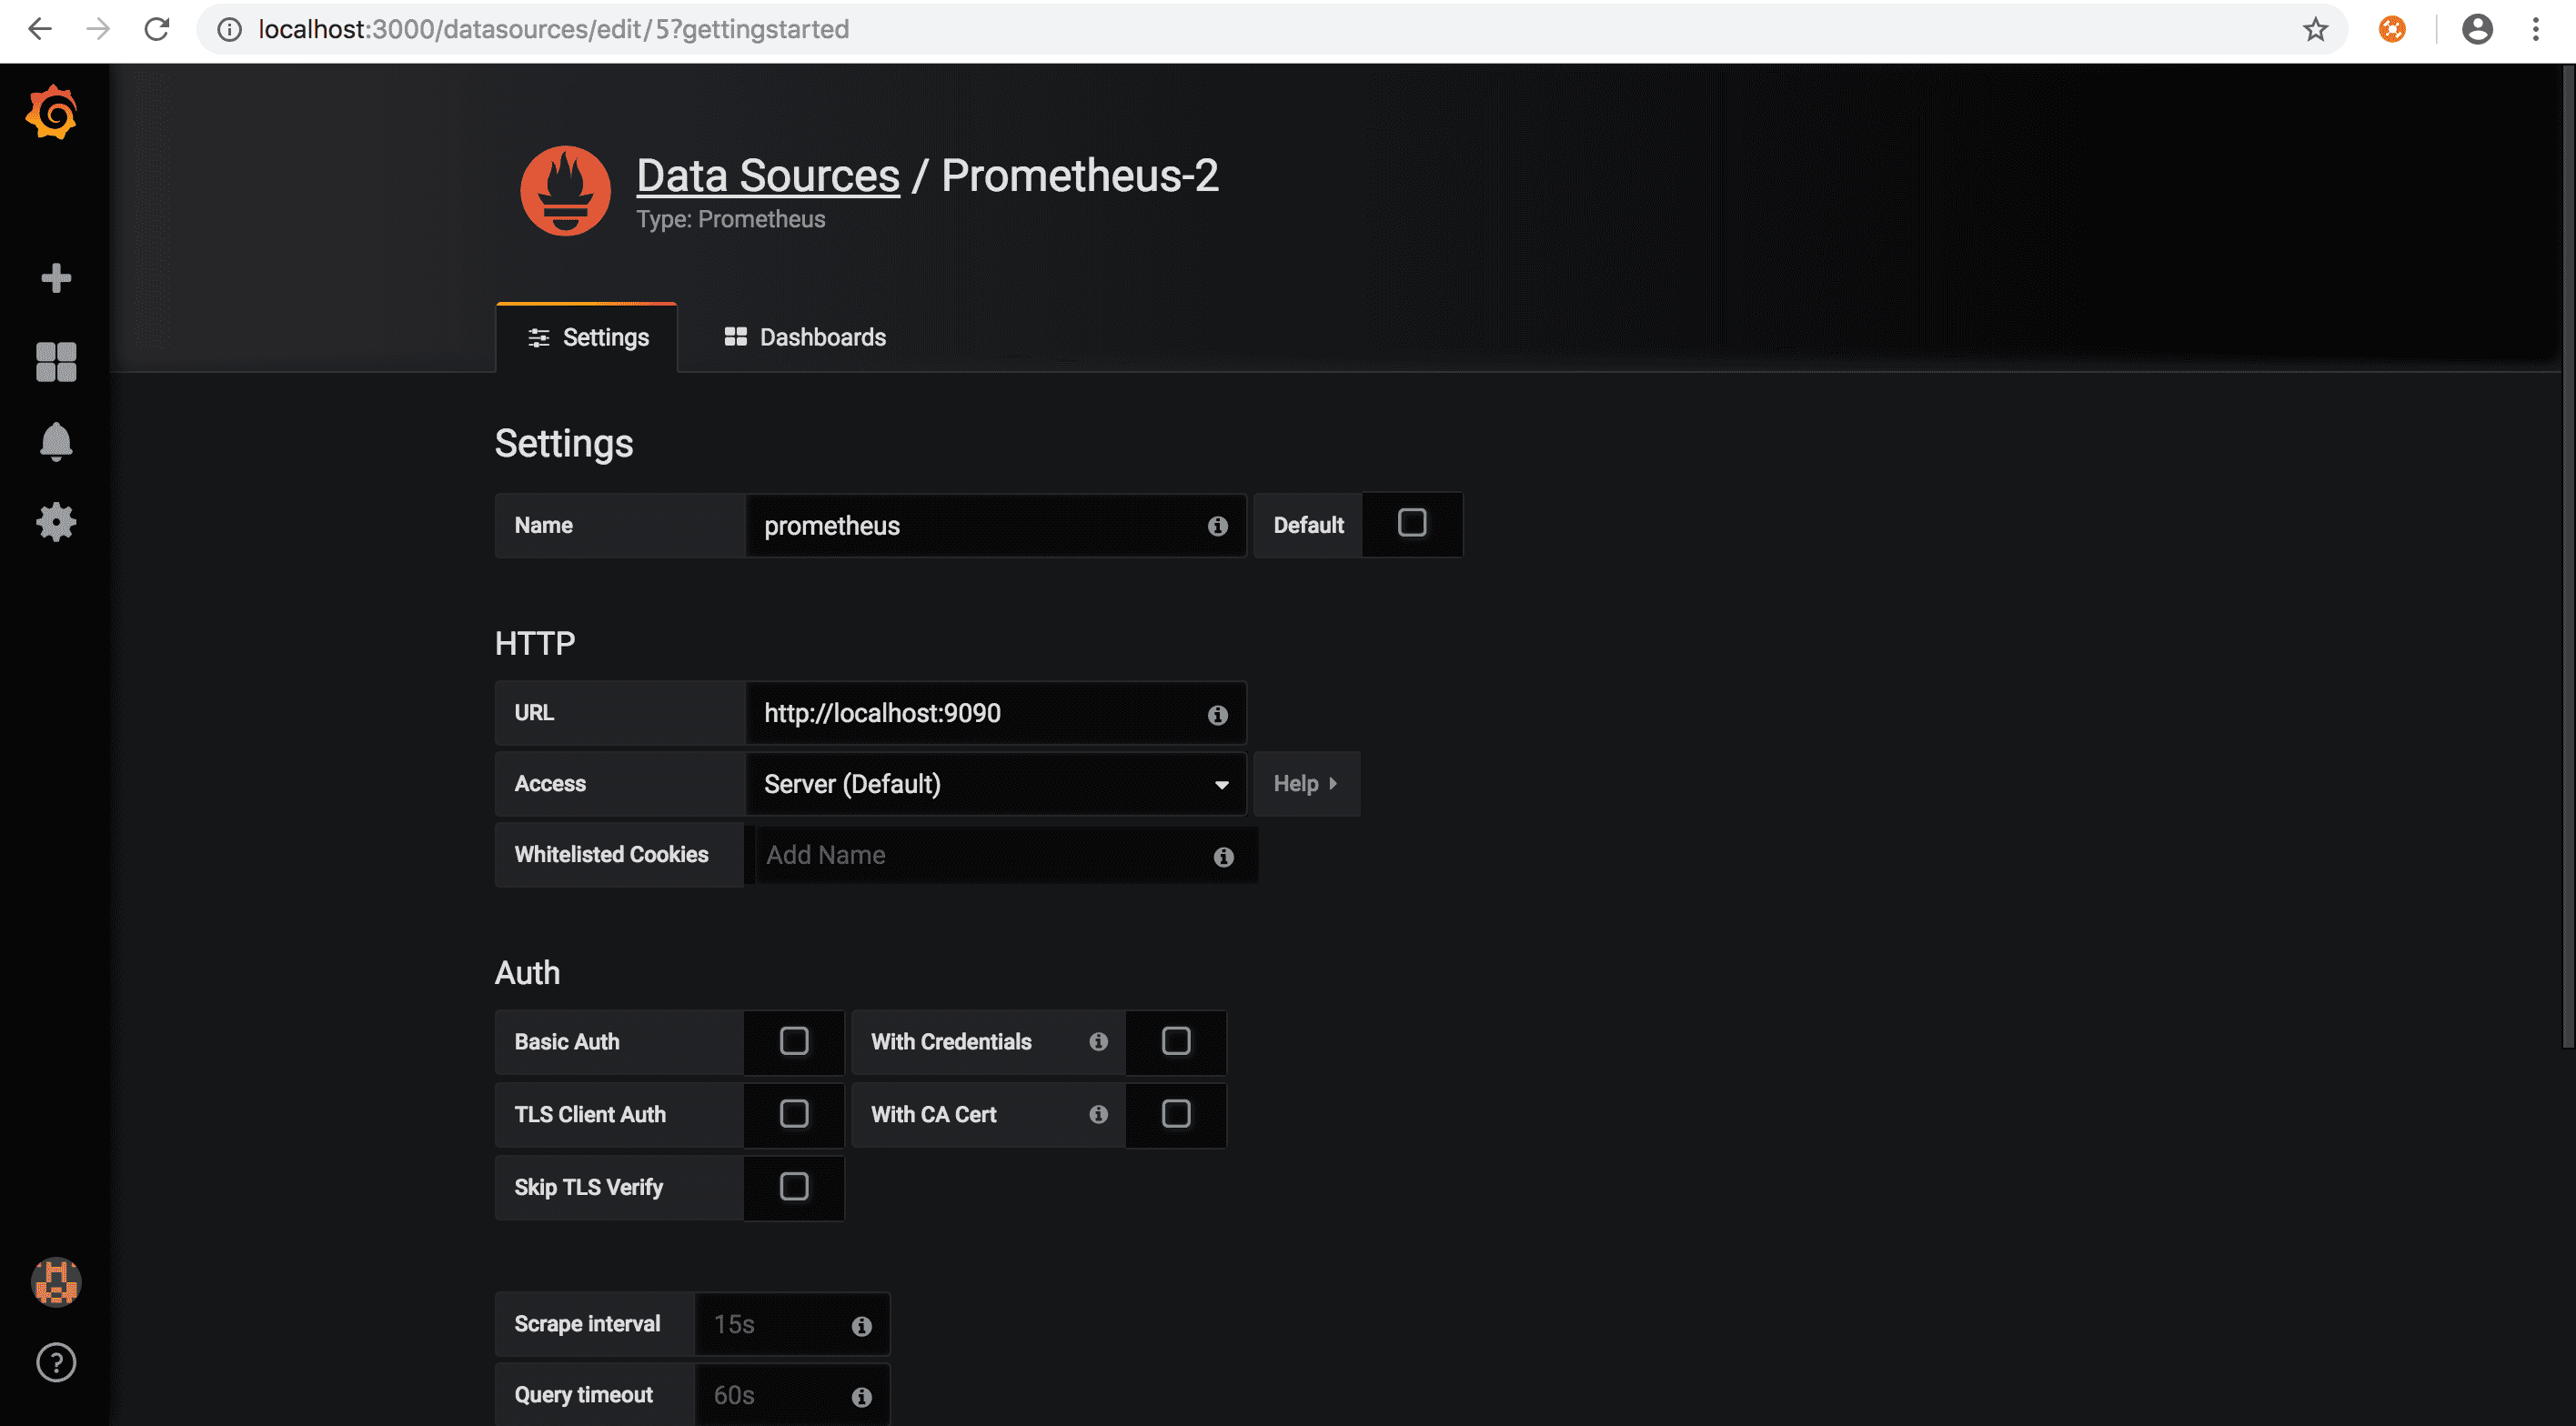
Configuring prometheus data source
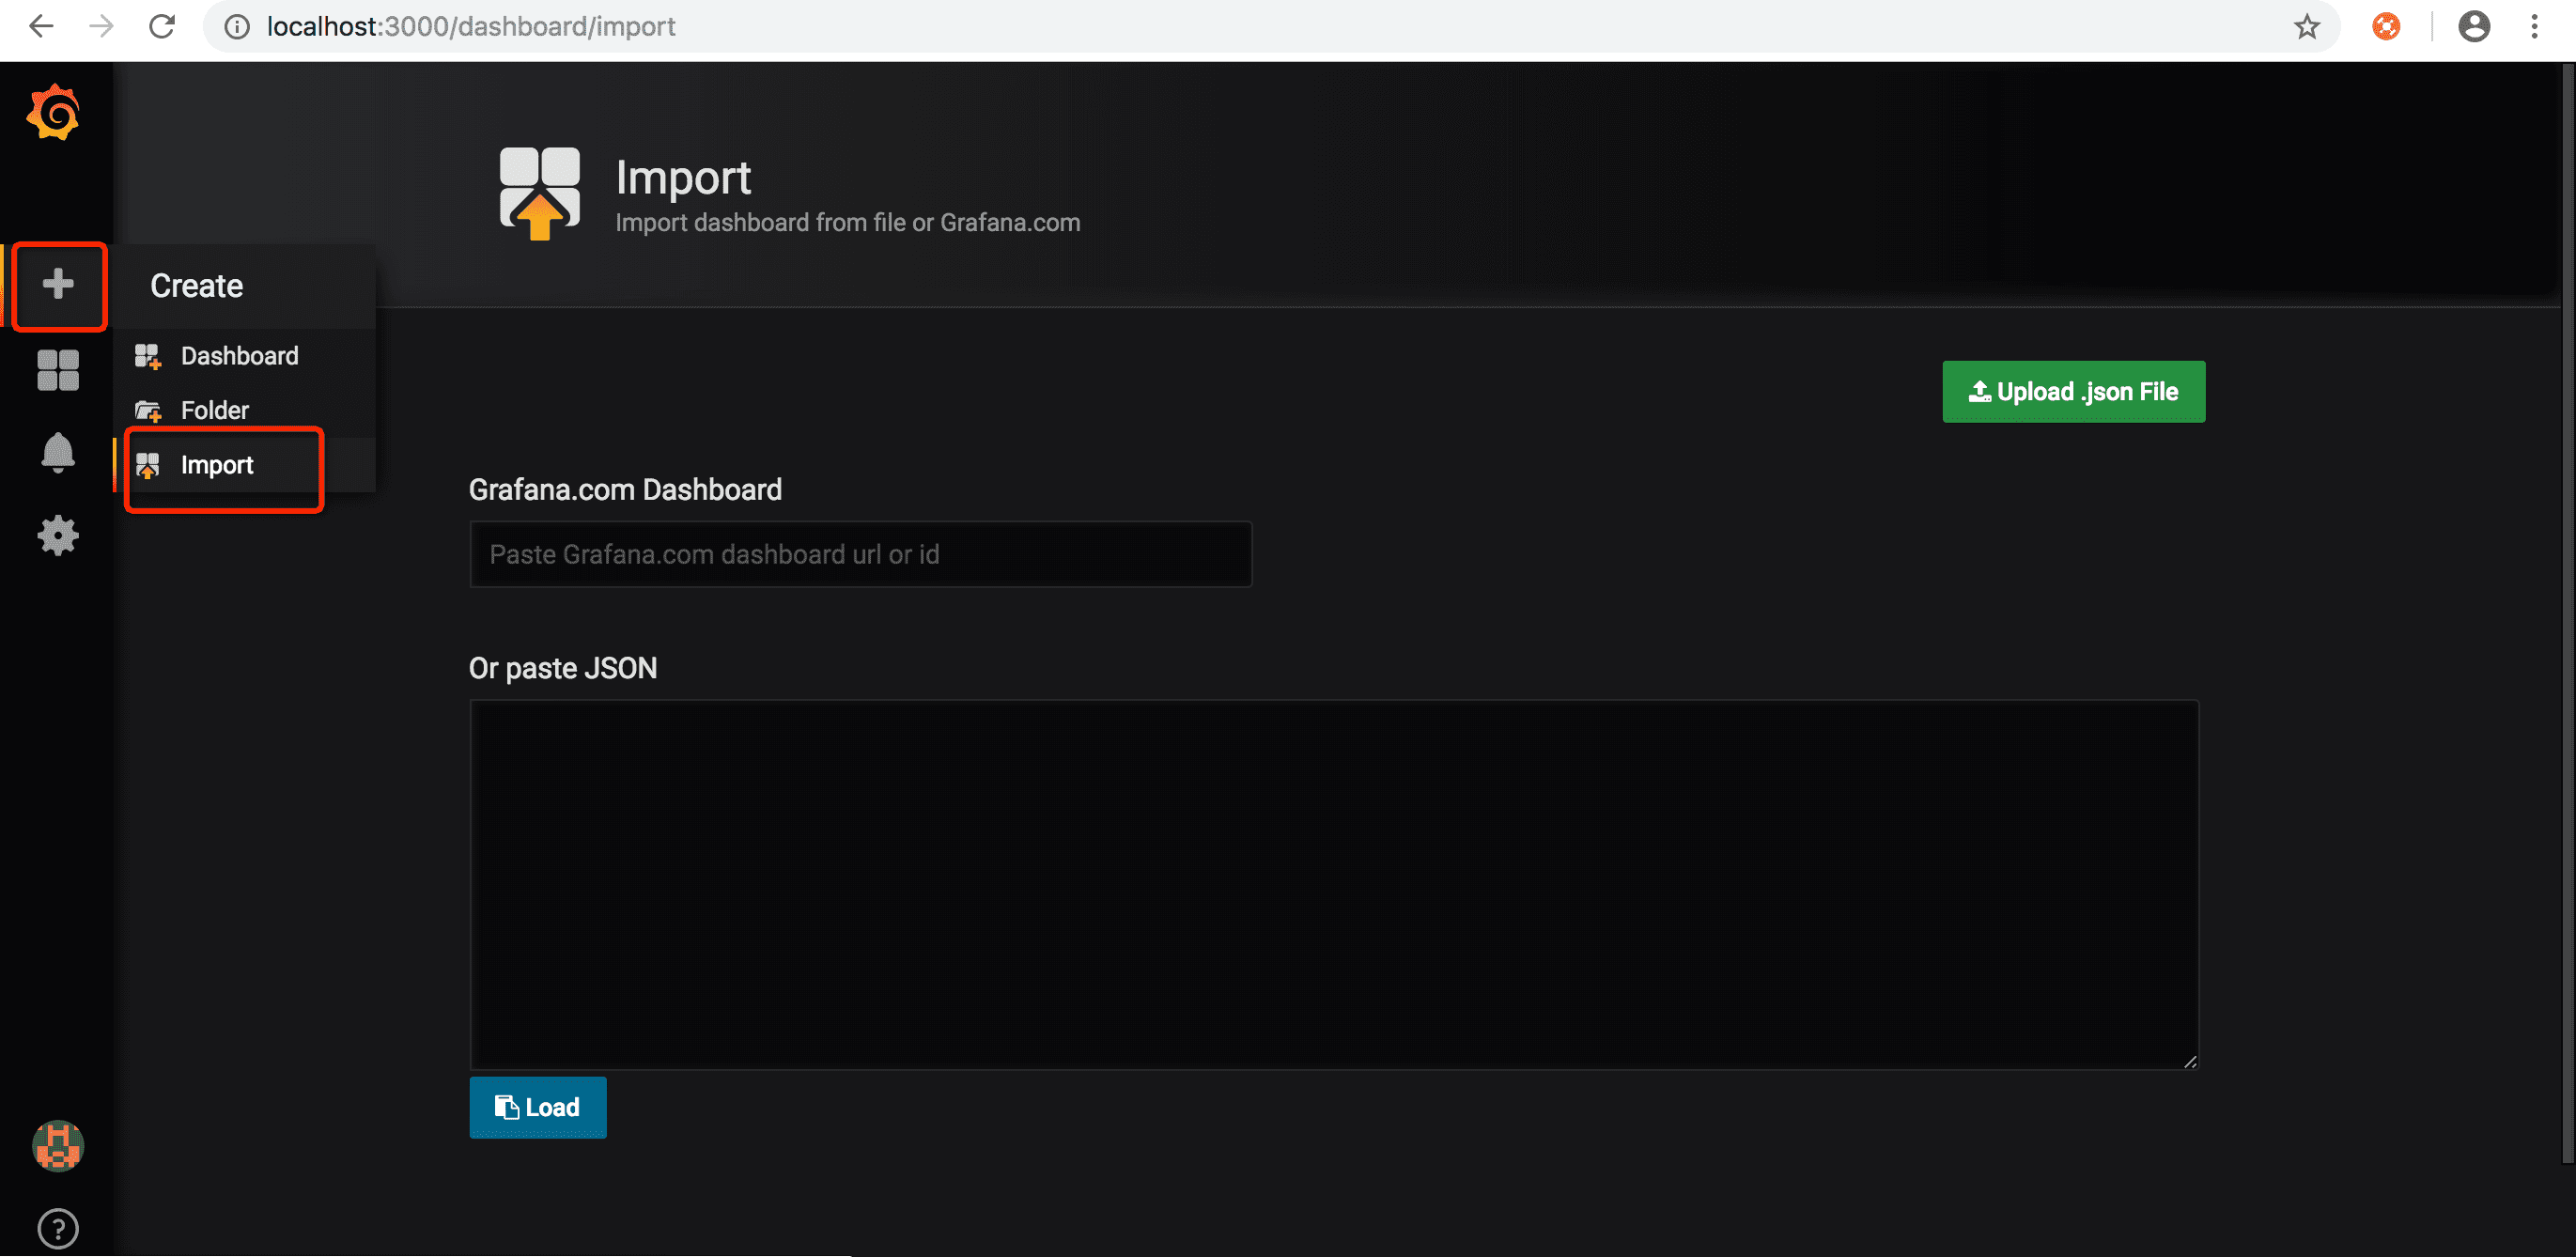
Import Nacos grafana monitoring template
Nacos monitoring is divided into three modules:
- nacos monitor shows core monitoring items
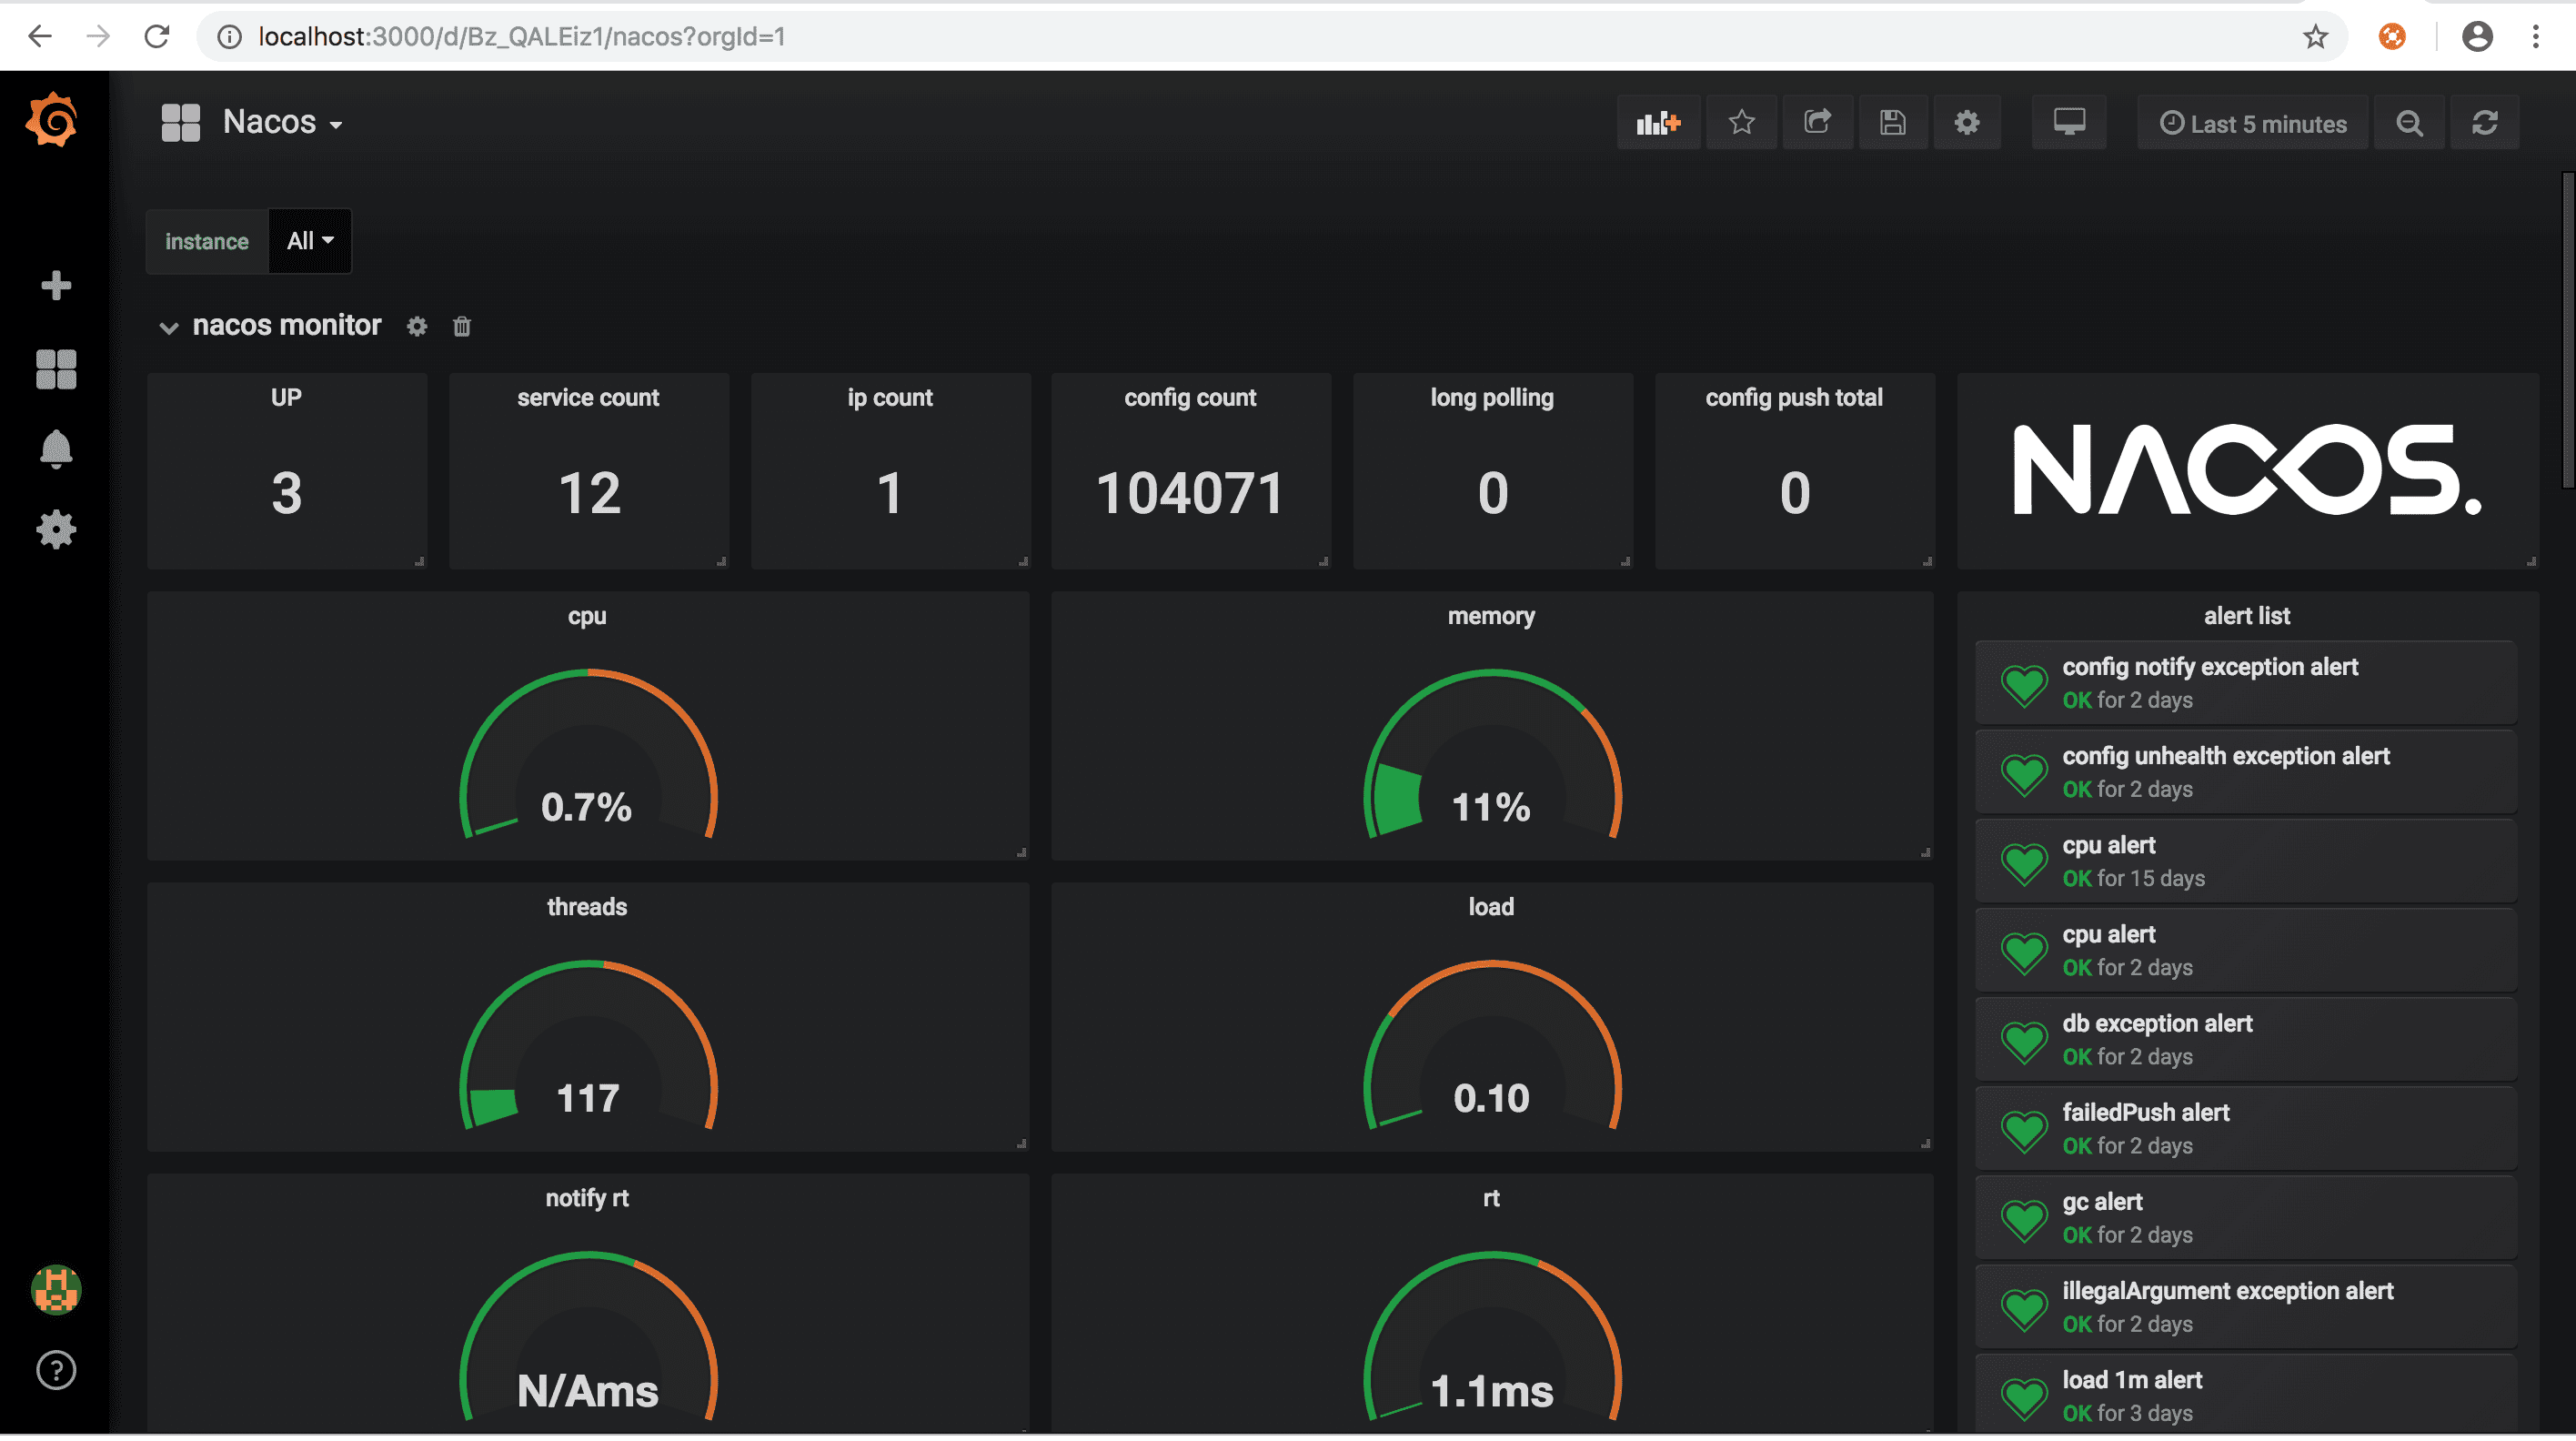
- nacos detail shows the change curve of index
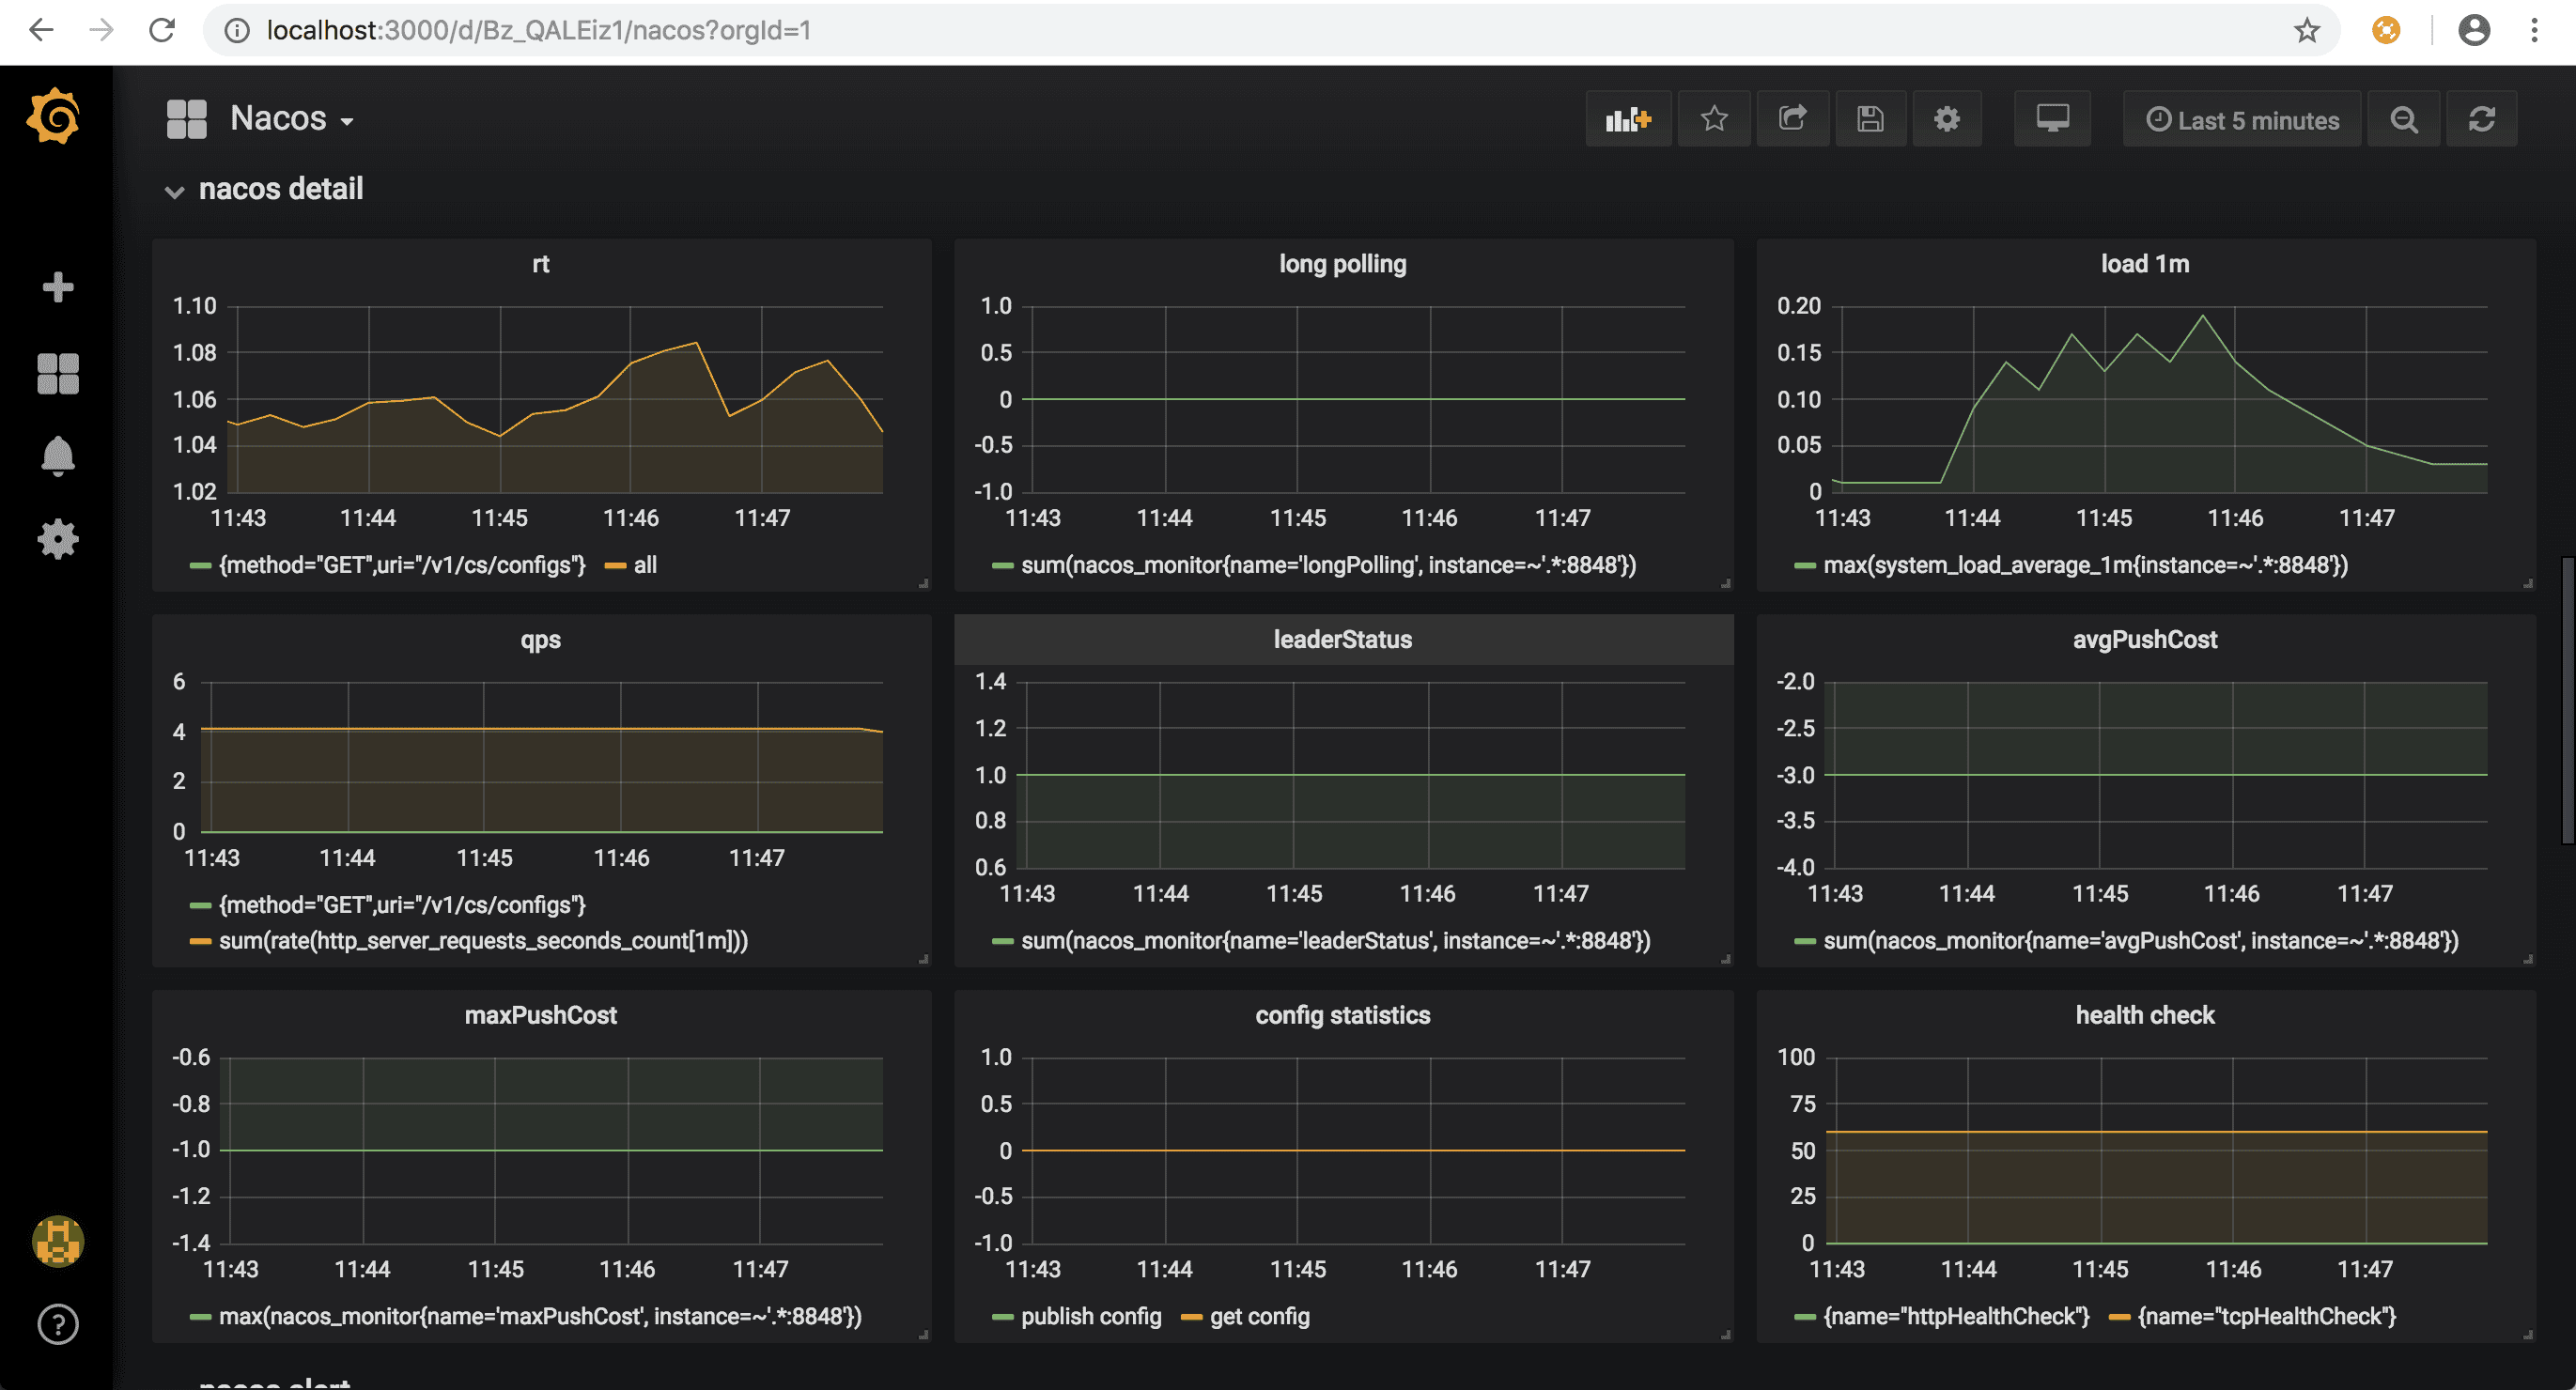
- nacos alert is alerts about nacos

configure grafana alert
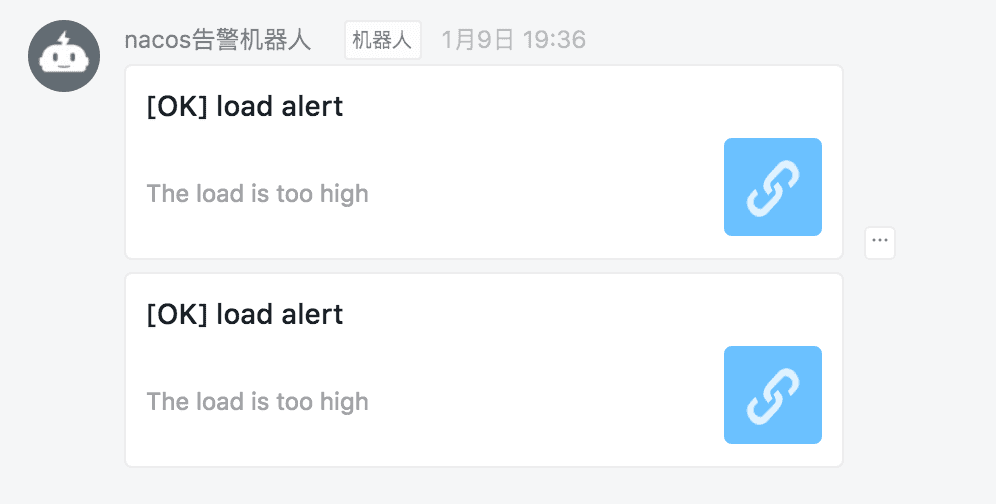
When Nacos runs out of order, Grafana can alert the person in charge. Grafana supports a variety of police alert. Mail, DingTalk and webhook are commonly used.
DingTalk alert
Configure DingTalk robots
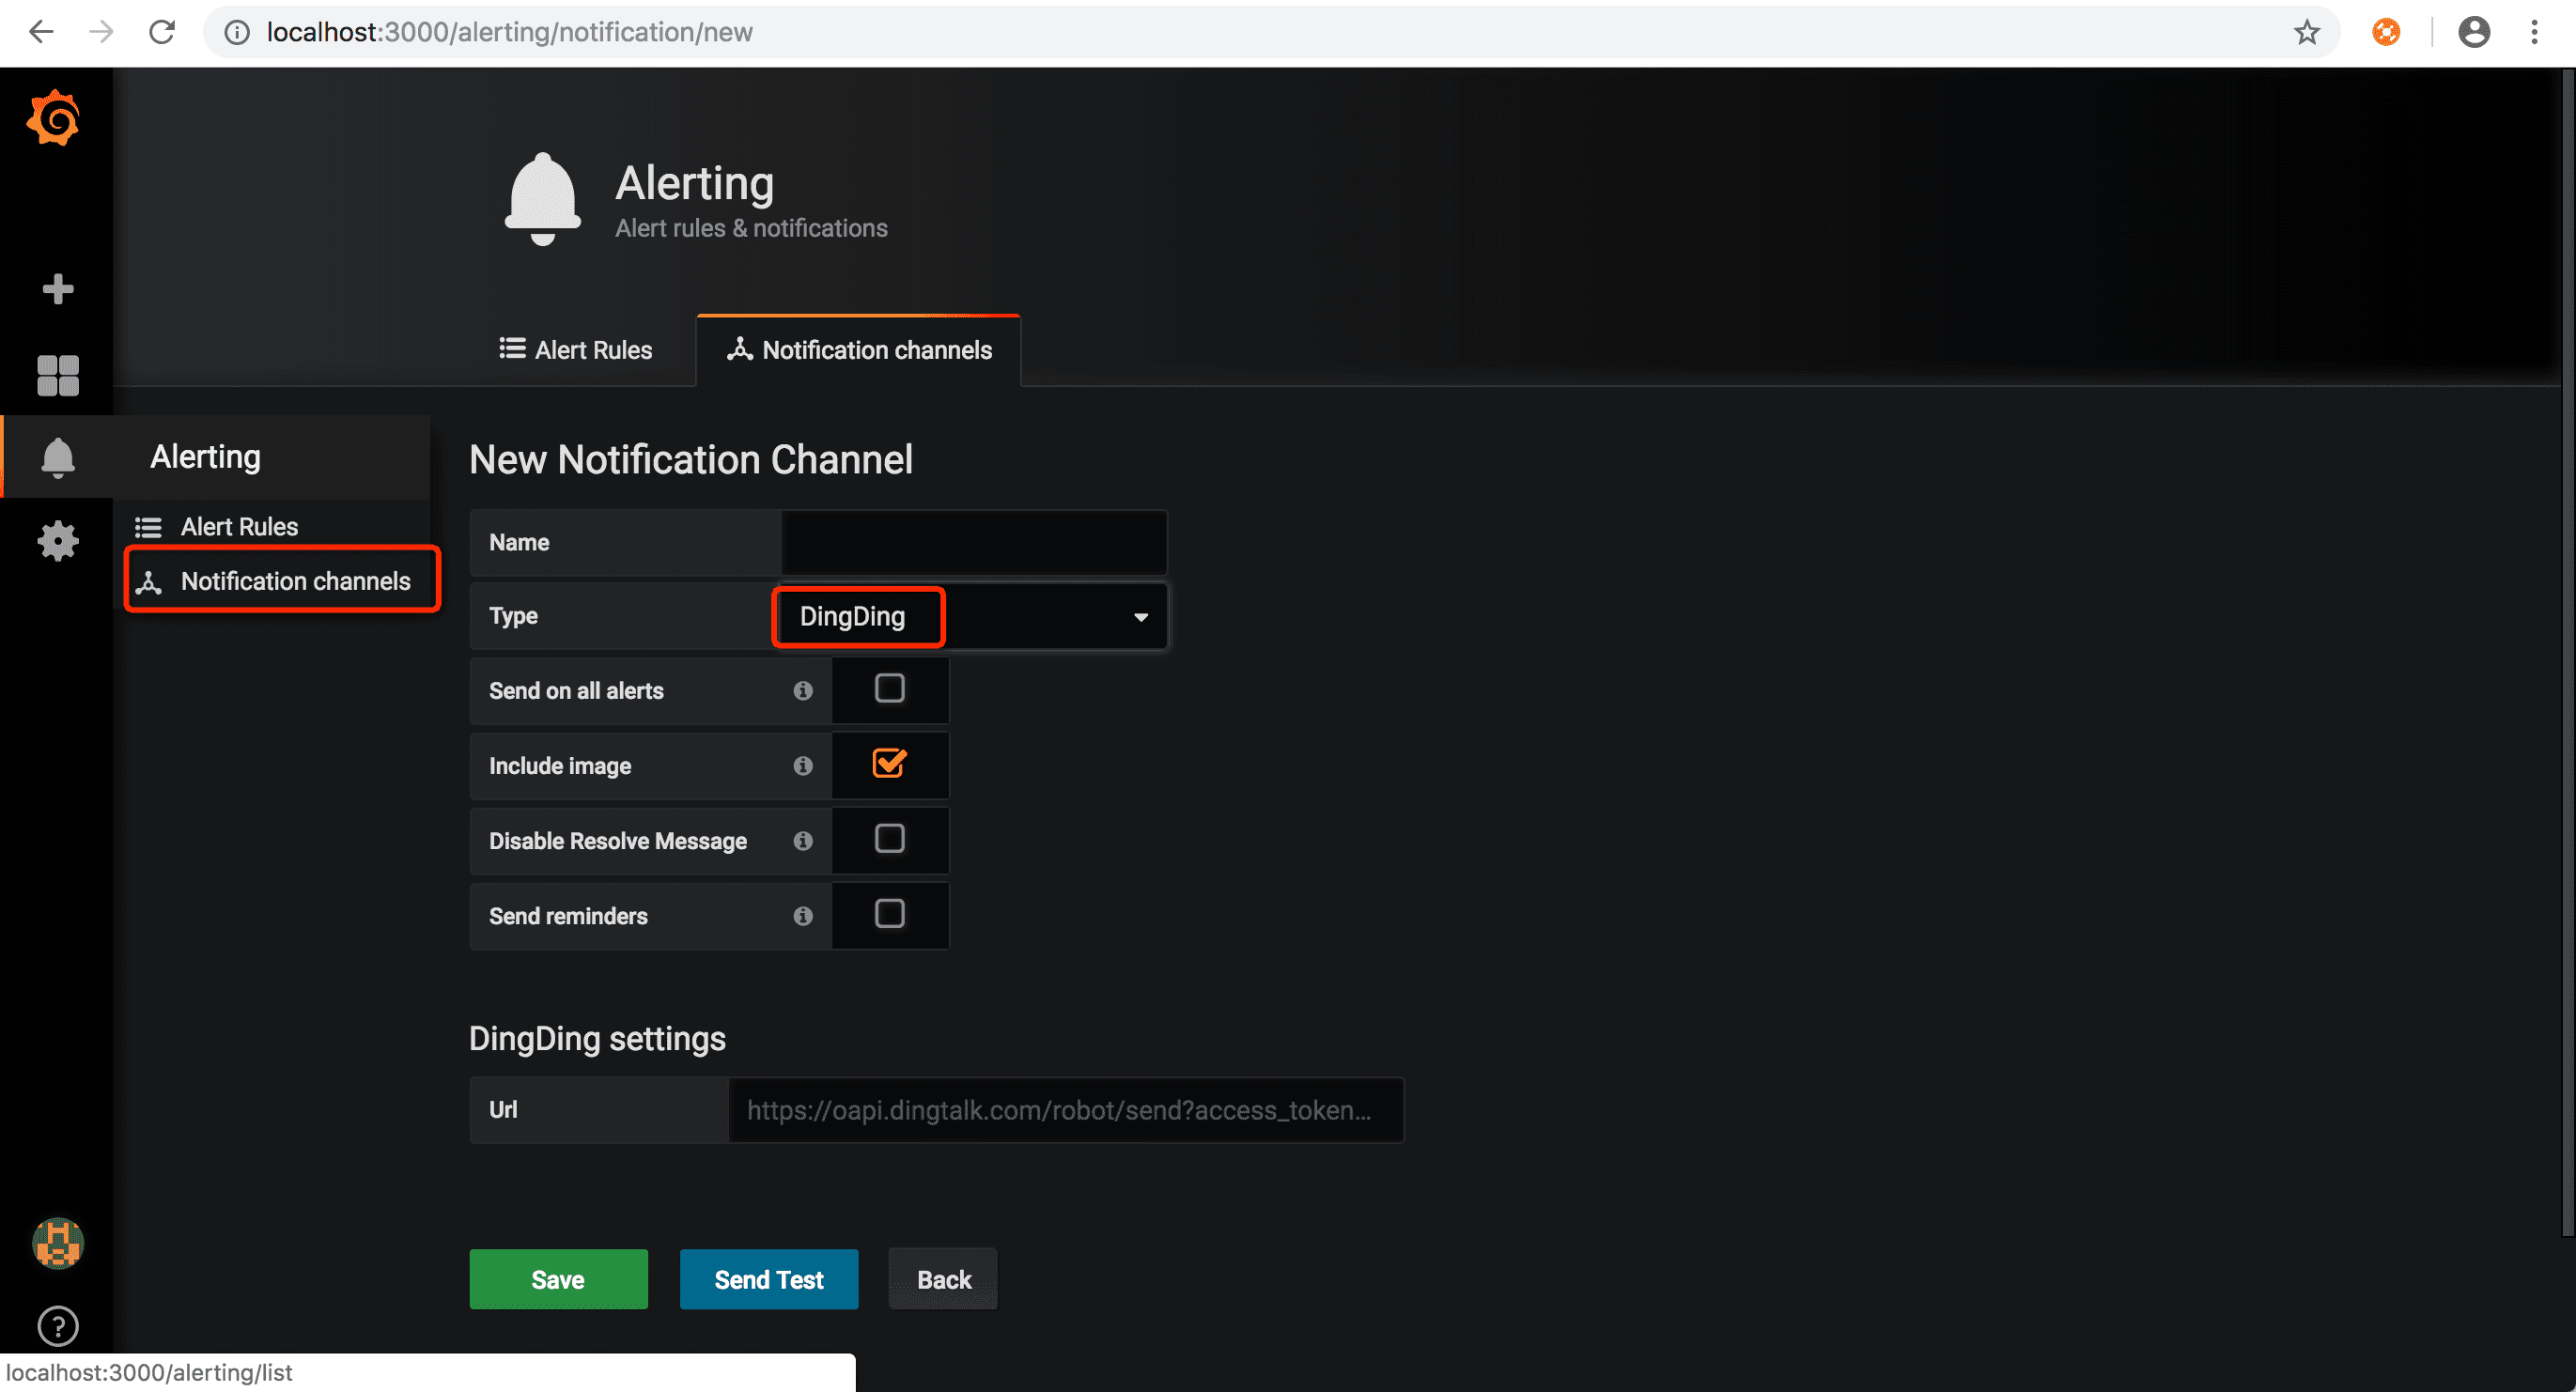
Configure DingTalk robots url

Test alert
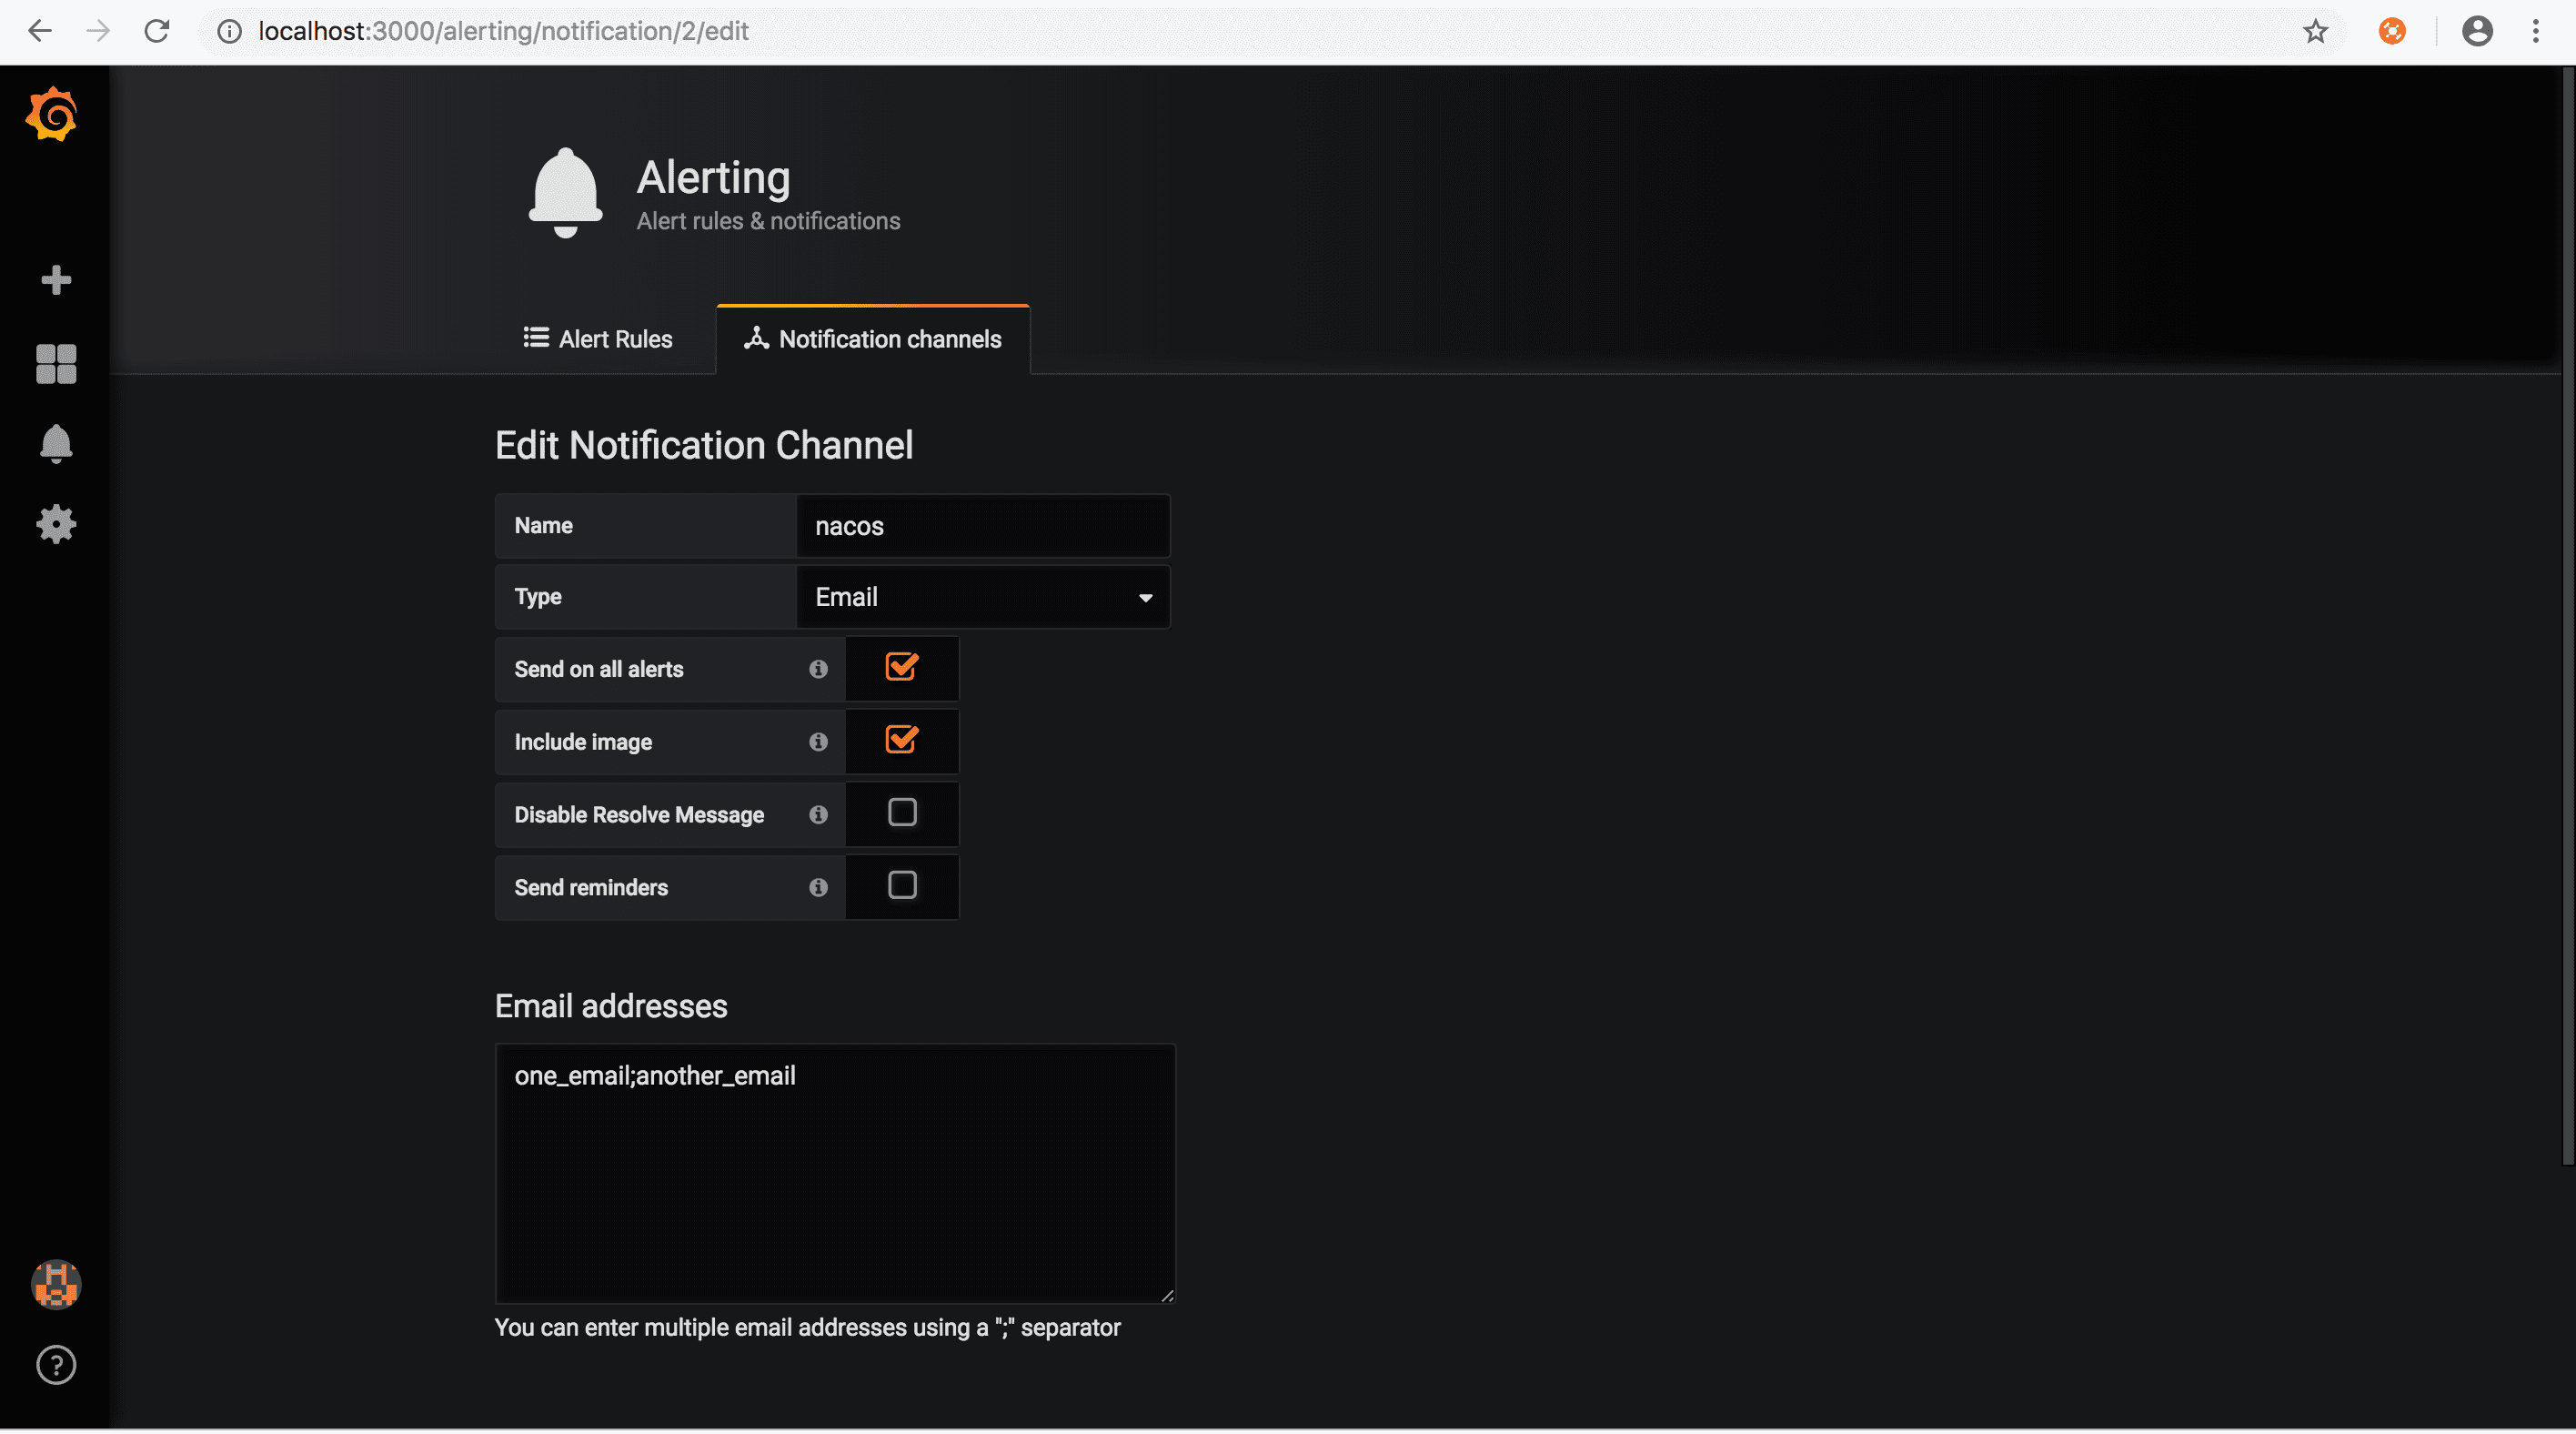
mail alert
Modify defaults.ini configuration file to add mail alerts
#################################### SMTP / Emailing ##########################
[smtp]
enabled = true
host = smtp.126.com:25
user = xxxxxx
password = xxxxx
;cert_file =
;key_file =
skip_verify = true
from_address = xxxxxx@126.com

[emails]
;welcome_email_on_sign_up = false
Configuration notification mailbox
meaning of Nacos metrics
jvm metrics
| item | meaning |
|---|---|
| system_cpu_usage | cpu usage |
| system_load_average_1m | load |
| jvm_memory_used_bytes | jvm memory used(bytes) |
| jvm_memory_max_bytes | jvm memory max(bytes) |
| jvm_gc_pause_seconds_count | gc count |
| jvm_gc_pause_seconds_sum | gc time |
| jvm_threads_daemon | jvm threads count |
Nacos metrics
| item | meaning |
|---|---|
| http_server_requests_seconds_count | http requests count |
| http_server_requests_seconds_sum | http requests time |
| nacos_timer_seconds_sum | Nacos config notify time |
| nacos_timer_seconds_count | Nacos config notify count |
| nacos_monitor{name='longPolling'} | Nacos config connection count |
| nacos_monitor{name='configCount'} | Nacos configuration file count |
| nacos_monitor{name='dumpTask'} | Nacos config dump task count |
| nacos_monitor{name='notifyTask'} | Nacos config notify task count |
| nacos_monitor{name='getConfig'} | Nacos config read configuration count |
| nacos_monitor{name='publish'} | Nacos config update configuration count |
| nacos_monitor{name='ipCount'} | Nacos naming ip count |
| nacos_monitor{name='domCount'} | Nacos naming domain count(1.x version) |
| nacos_monitor{name='serviceCount'} | Nacos naming domain count(2.x version) |
| nacos_monitor{name='failedPush'} | Nacos naming push fail count |
| nacos_monitor{name='avgPushCost'} | Nacos naming push cost time(average) |
| nacos_monitor{name='leaderStatus'} | Nacos naming if node is leader |
| nacos_monitor{name='maxPushCost'} | Nacos naming push cost time(max) |
| nacos_monitor{name='mysqlhealthCheck'} | Nacos naming mysql health check count |
| nacos_monitor{name='httpHealthCheck'} | Nacos naming http health check count |
| nacos_monitor{name='tcpHealthCheck'} | Nacos naming tcp health check count |
nacos exception
| item | meaning |
|---|---|
| nacos_exception_total{name='db'} | database exception |
| nacos_exception_total{name='configNotify'} | Nacos config notify exception |
| nacos_exception_total{name='unhealth'} | Nacos config server health check exception |
| nacos_exception_total{name='disk'} | Nacos naming write disk exception |
| nacos_exception_total{name='leaderSendBeatFailed'} | Nacos naming leader send heart beat fail count |
| nacos_exception_total{name='illegalArgument'} | request argument illegal count |
| nacos_exception_total{name='nacos'} | Nacos inner exception |
client metrics
| item | meaning |
|---|---|
| nacos_monitor{name='subServiceCount'} | subscribed services count |
| nacos_monitor{name='pubServiceCount'} | published services count |
| nacos_monitor{name='configListenSize'} | listened configuration file count |
| nacos_client_request_seconds_count | request count |
| nacos_client_request_seconds_sum | request time |
Nacos-Sync monitor
With the release of Nacos 0.9, Nacos-Sync 0.3 supports metrics monitoring. It can observe the running status of Nacos-Sync service through metrics data, and improve the monitoring capability of Nacos-Sync in production environment. Reference for the Construction of the Overall Monitoring System Nacos Monitoring Manual
grafana monitor Nacos-Sync
The same as Nacos monitoring, Nacos-Sync also provides monitoring templates to import monitoring Nacos-Sync templates
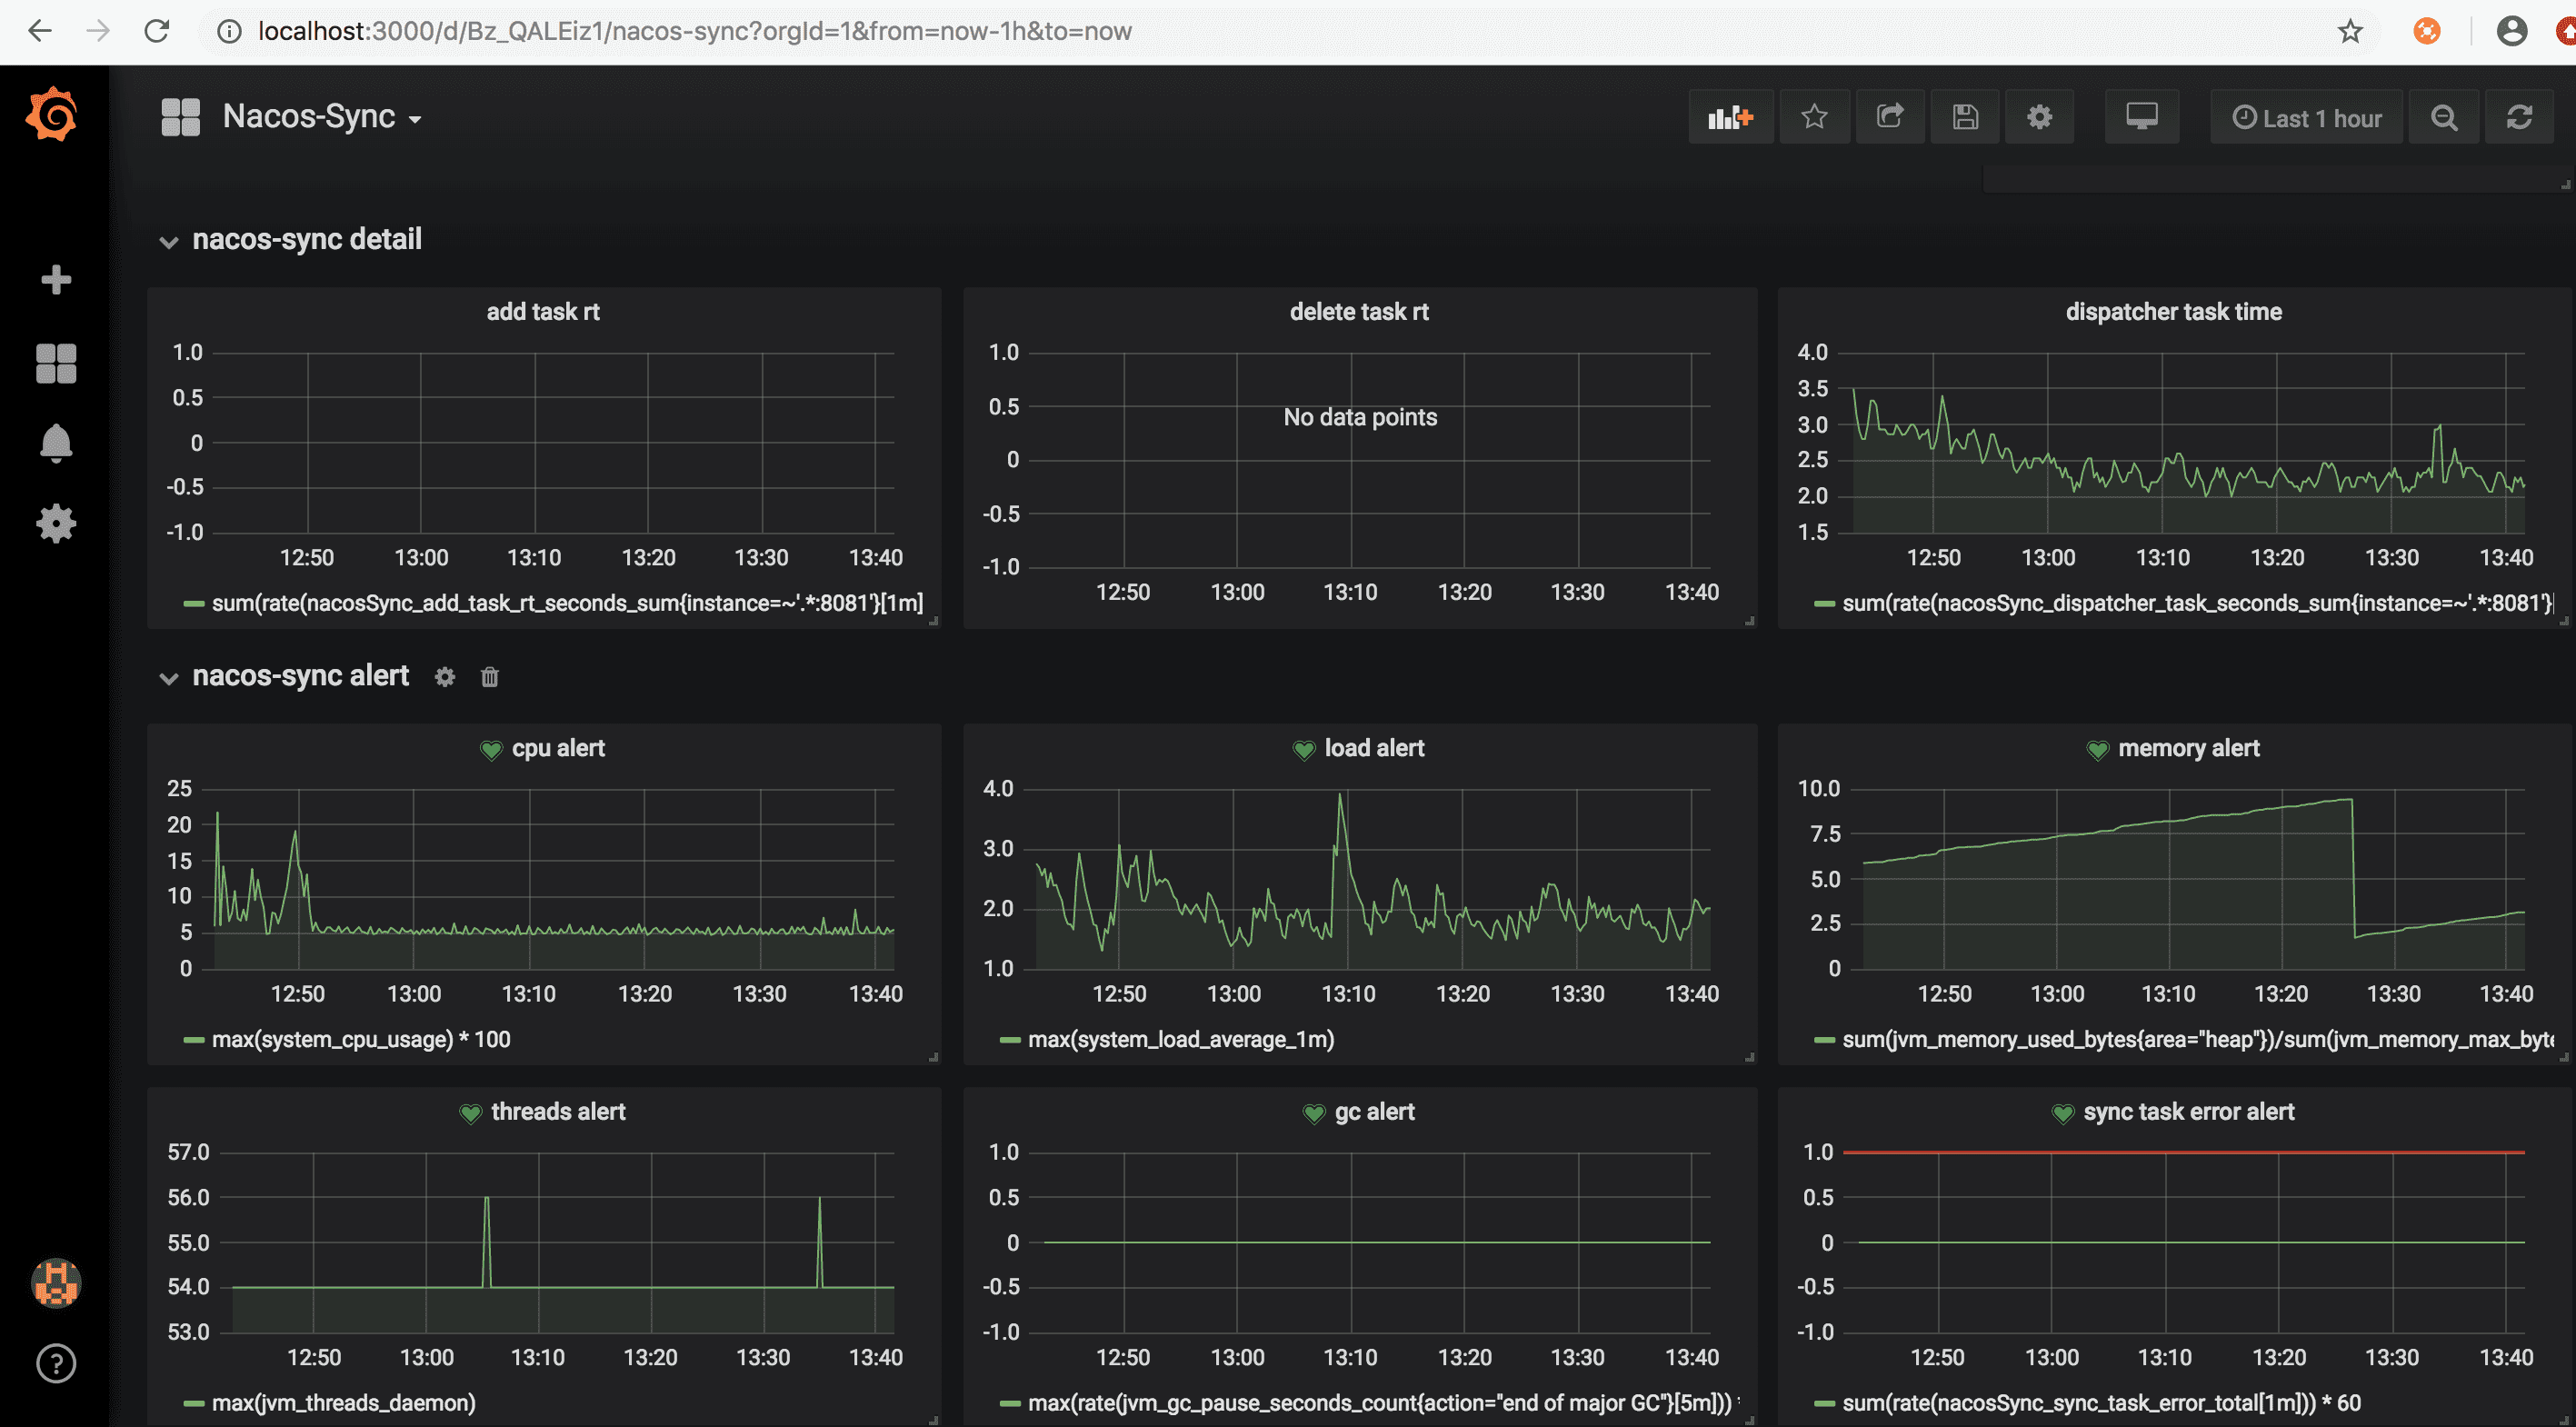
Nacos-Sync monitoring is also divided into three modules:
- nacos-sync monitor shows core monitoring items

- nacos-sync detail and alert shows monitoring curves and alarms.
Nacos-Sync metrics meaning
Nacos-Sync metrics is divided into JVM layer and application layer
jvm metrics
| item | meaning |
|---|---|
| system_cpu_usage | cpu usage |
| system_load_average_1m | load |
| jvm_memory_used_bytes | jvm memory used(bytes) |
| jvm_memory_max_bytes | jvm memory max(bytes) |
| jvm_gc_pause_seconds_count | gc count |
| jvm_gc_pause_seconds_sum | gc time |
| jvm_threads_daemon | jvm threads count |
application metrics
| item | meaning |
|---|---|
| nacosSync_task_size | sync task count |
| nacosSync_cluster_size | cluster count |
| nacosSync_add_task_rt | add task time |
| nacosSync_delete_task_rt | delete task time |
| nacosSync_dispatcher_task | dispatcher task time |
| nacosSync_sync_task_error | sync task error count |