Nacos service configuration performance test report
Test purposes
Let everybody understand the Nacos main performance load and capacity, to help us better manage Nacos performance quality, help users use of assessment Nacos system load faster.
Test tools
We use the research of PAS performance evaluation service platform for pressure measurement, the principle is based on the use of JMeter engine, the use of PAS to automatically generate the JMeter scripts, intelligent pressure measurement.

Test environment
1.environment
| indicators | parameter |
|---|---|
| machine | CPU 8 nuclear, 16G memory |
| cluster size | stand-alone, 3 nodes, 10 nodes, 100 nodes |
| Nacos version | 0.8.0 |
| database | 32C128G |
2.Set the launch parameters
/opt/taobao/java/bin/java -server -Xms4g -Xmx4g -Xmn2g-XX:MetaspaceSize=128m-XX:MaxMetaspaceSize=320m-Xdebug-Xrunjdwp:transport=dt_socket,address=9555,server=y,suspend=n-XX:+UseConcMarkSweepGC-XX:+UseCMSCompactAtFullCollection-XX:CMSInitiatingOccupancyFraction=70-XX:+CMSParallelRemarkEnabled -XX:SoftRefLRUPolicyMSPerMB=0-XX:+CMSClassUnloadingEnabled -XX:SurvivorRatio=8-XX:-UseParNewGC -verbose:gc -Xloggc:/home/admin/nacos/logs/nacos_gc.log-XX:+PrintGCDetails -XX:+PrintGCDateStamps -XX:+PrintGCApplicationStoppedTime-XX:+PrintAdaptiveSizePolicy -Dnacos.home=/home/admin/nacos -XX:-OmitStackTraceInFastThrow-XX:-UseLargePages -jar /home/admin/nacos/target/nacos-server.jar--spring.config.location=classpath:/,classpath:/config/,file:./,file:./config/,file:/home/admin/nacos/conf/Test scenarios
The following test scenarios are service discovery interface:
- Verify Nacos service ability to release configuration
- Verify Nacos service access configuration
- Verify Nacos service listening configuration
- Verify Nacos service long connection capacity ability
Test data
1. Release configuration
The performance of the main test launch configuration Nacos publishConfig interface.
In the performance of each scale clusters:
| stand-alone | 3 nodes | 10 nodes | 100 nodes |
|---|---|---|---|
| 1400 | 4214 | 6863 | 8626 |
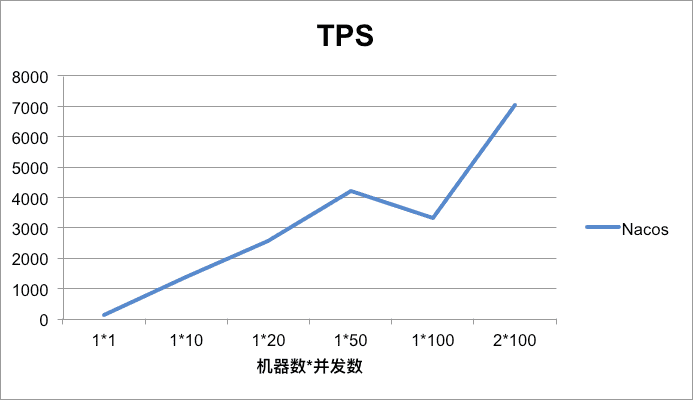
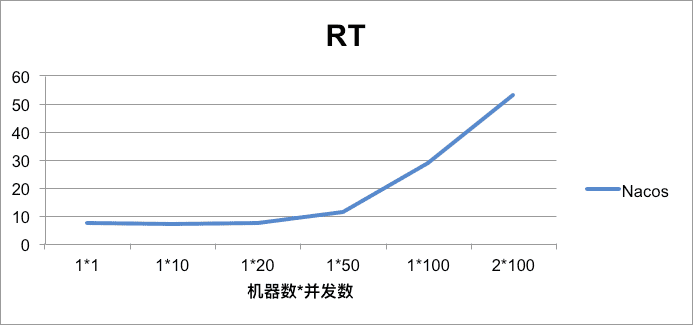
We look at three nodes specific services cluster configuration ability.
The following for each concurrency (press the machine number * concurrency), the configuration of the TPS, the average RT.


2. Access configuration
Access to configuration for Nacos getConfig interface for testing.
The measured performance in each cluster size:
| stand-alone | 3 nodes | 10 nodes | 100 nodes |
|---|---|---|---|
| 15000 | 23013 | 45000 | 161099 |
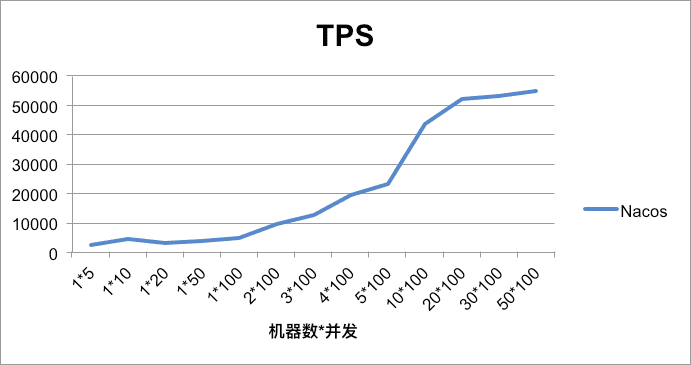
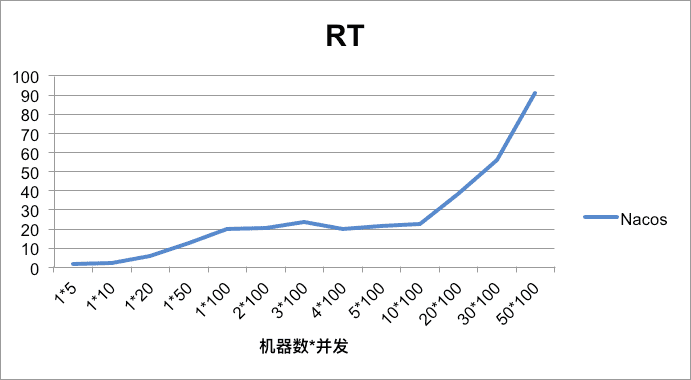
We also look at the three nodes specific services cluster acquire configuration, the following for each concurrency (pressure machine is used for * concurrency), access to configuration of TPS, the average RT.


3. Listening configuration
Perform Nacos addListeners the performance of the interface to monitor configuration mainly adopts increase more configuration monitoring, and issued several configuration method, statistics released time and listening to receive configuration time interval.
We pick a few points, and lists the publish and listening time, the basic within 100 ms can listen to the configuration changes.
| times | publish and listening time (ms) |
|---|---|
| 1 | 63 |
| 2 | 53 |
| 3 | 84 |
| 4 | 73 |
| 5 | 46 |
| 6 | 35 |
| 7 | 73 |
| 8 | 183 |
| 9 | 104 |
4. Long connection capacity test
Nacos listener configuration with the client to establish long connection, long service connection consumes memory, thereby cluster increased load.Build up capability of the capacity of long connection, mainly examines configuration monitor bottlenecks.
Cluster connectivity test methods are increasing stand-alone connection to reach 9000, CPU: 13.9% memory: 18.8%, load: 4.7, are in normal state, the number of connections increases, the load will increase exponentially number level.
In each cluster scale test basically conform to test and verify.
| stand-alone | 3 nodes | 10 nodes | 100 nodes |
|---|---|---|---|
| 9000 | 27000 | 90000 | 910000 |
Test results
Nacos performance test is aimed at a key function, through the study of the pressure measurement of the cluster size, you can see the interface of each cluster capacity.
This test provides you as reference, if there are any deficiency or deviation, please correct me!
If you have any other requirements on the performance, can you give us the issue.
